Overview
Project Overview Summary Cards
The Overview tab of your Project displays a set of summary cards that give you an at-a-glance view of Project health. These cards are hidden for labeling-services-only Projects. Top row — stat cards A row of three compact stat cards appears above the task-status chart:
Task status chart
The task status bar chart displays the number of tasks at each stage of your Workflow. When no task data is available, the chart displays an empty state illustration with the message “Configure data to see tasks status” instead of a blank chart. Tooltips are also disabled in this state.
Bottom row — distribution cards
Below the task-status chart, two cards appear side by side:
- Class Distribution — shows the top 5 and bottom 5 Ontology classes by label instance count. The subtitle displays the total number of label instances. Click Show analytics to open the Labels analytics tab. When no label instances exist yet, the card displays “Instance labels by class will appear here.”
- Top Issue Tags — shows up to 10 issue tags ranked by frequency, with amber-colored horizontal bars. The subtitle displays the total number of issue tags created. Click Show analytics to open the Issues analytics tab. When no issue tags are configured or used, the card displays an empty state with a Setup issue tags link to your issue-tag settings.
The tag counts on the Top Issue Tags card reflect tag-action totals (including re-rejections), not unique issue counts. The No tag bucket — representing issues with no tag applied — is an approximation and may show 0 even when untagged issues exist. An accurate untagged count requires a future backend update.
Workflow Mini-Map
Annotation, review, and other queue-type stage nodes in the mini-map are clickable. Clicking a stage node navigates you directly to the Queue tab, pre-filtered to that stage. The following node types are not clickable and do not navigate to the Queue:- Start
- Percentage Router
- User Router
Analytics
The Analytics tab of your Project shows event-based analytics for your Project’s tasks, labels, and users. The Analytics tab has the following views:- Tasks: View analytics on specific tasks in your Project.
- Labels: View analytics of labels in your Project.
- Collaborators: View collaborator performance in your Project.
- Issues: View analytics relating to issues in your Project.
- Agents: View analytics relating to Agent stages in your Project.
The analytics available on the Analytics dashboard vary based on user roles:
- Admins and Team Managers have access to the Tasks, Labels, and Collaborators views, offering a comprehensive overview of team performance.
- Annotators, Reviewers, and Annotator + Reviewer roles can only view the Task Actions, Time Spent, and Label Actions tables, limited to their individual contributions.
Top row — stat cards
A row of three compact stat cards appears above the task-status chart:
Bottom row — distribution cards
Below the task-status chart, two cards appear side by side:
- Class Distribution — shows the top 5 and bottom 5 Ontology classes by label instance count. The subtitle displays the total number of label instances. Click Show analytics to open the Labels analytics tab. When no label instances exist yet, the card displays “Instance labels by class will appear here.”
- Top Issue Tags — shows up to 10 issue tags ranked by frequency, with amber-colored horizontal bars. The subtitle displays the total number of issue tags created. Click Show analytics to open the Issues analytics tab. When no issue tags are configured or used, the card displays an empty state with a Setup issue tags link to your issue-tag settings.
The tag counts on the Top Issue Tags card reflect tag-action totals (including re-rejections), not unique issue counts. The No tag bucket — representing issues with no tag applied — is an approximation and may show 0 even when untagged issues exist. An accurate untagged count requires a future backend update.
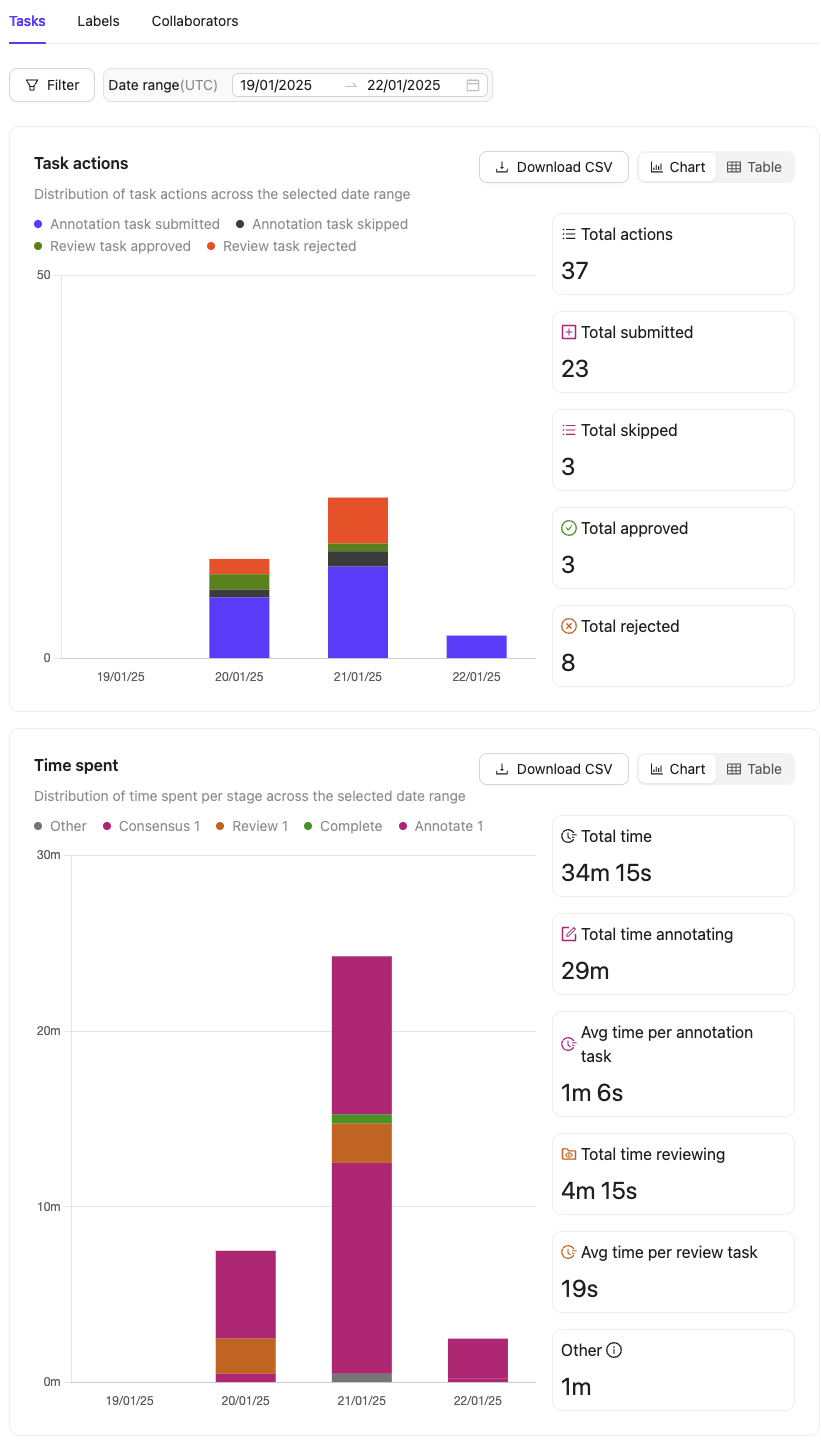
Tasks
-
How productive was each collaborator in terms of labeling and reviewing tasks over the last week?
- By filtering the data by Collaborators and Date time range, you can see how many tasks each team member worked on and how much time they spent on labeling and reviewing.
-
Which Dataset has the most labels added, edited, or deleted in a given Workflow stage?
- You can filter by Datasets and Workflow stage to see which Dataset is being worked on the most and how many labels are being modified at each stage of the process.
The Task performance table includes the following columns:
- File name: The name of the file associated with the task.
- Data type: The type of file used in the task (example: image, video, DICOM).
- Dataset: The Dataset from which the task originates.
- Total time: The total time spent on the task.
- Total created labels: The number of labels created in the task.
- Total edited labels: The number of labels that were modified in the task.
- Total deleted labels: The number of labels that were removed in the task.
- Time spent - The amount of time spent in a specific Workflow stage.
- Collaborators - The users who contributed to a specific Workflow stage.
- Created labels - The number of labels created in a specific Workflow stage.
- Edited labels - The number of labels modified in a specific Workflow stage. In review stages, this refers to Edit Review.
- Deleted labels - The number of labels removed in a specific Workflow stage.
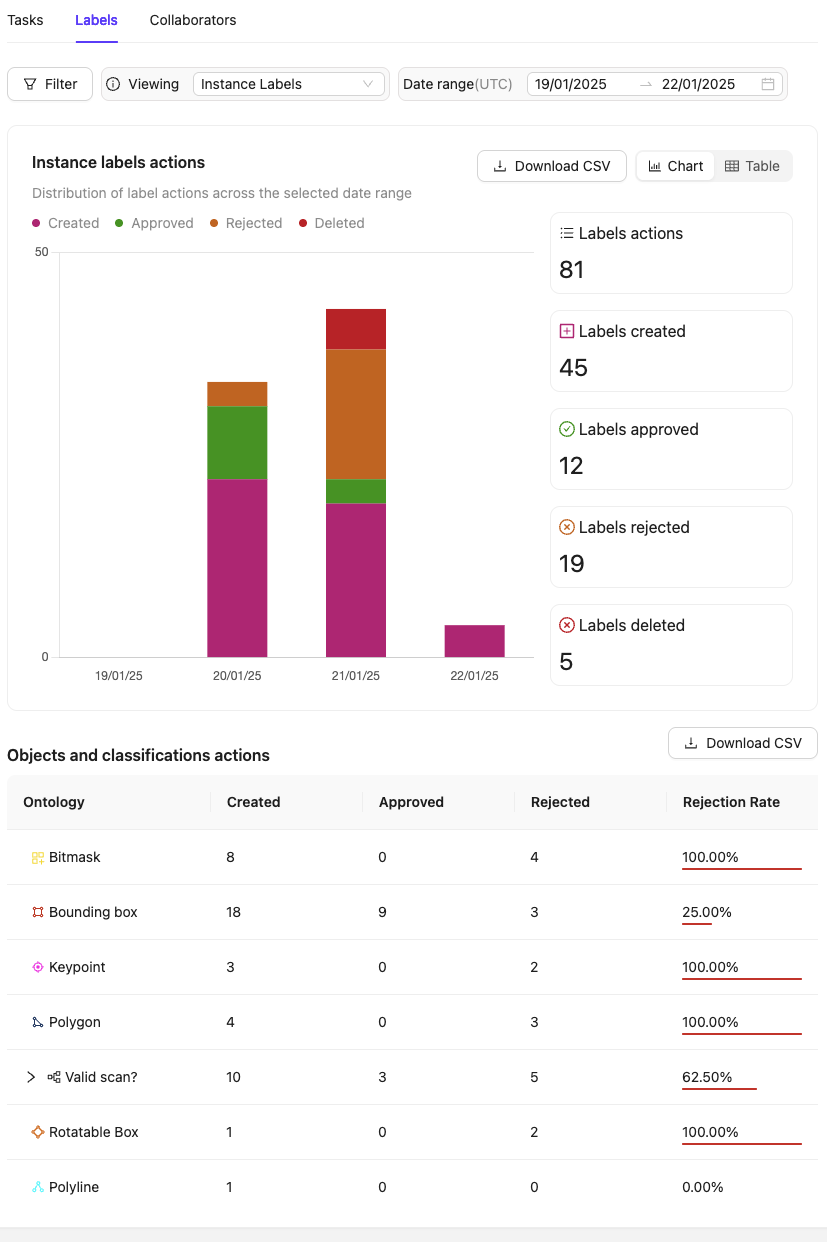
Labels
-
How many labels were submitted, approved, or rejected by the team over a given period?
- Use the Label actions chart and apply the Date time range filter to view the total number of labels submitted, approved, or rejected within the selected time frame.
-
What actions have been taken for specific objects and classifications in the Ontology?
- Refer to the Objects and classifications actions chart and expand classifications within the Ontology column to see detailed statistics for each classification answer.
-
How does the team’s productivity in labeling compare across different objects or classifications? Do certain objects take more time to label than others?
- Analyze the Created, Approved, and Rejected columns in the Objects and classifications actions table to identify objects or classifications that might require additional review or clarification using their Rejection rate.
- Compare the average time spent per object or classification by utilizing time-tracking metrics alongside these productivity statistics.
The Objects and classifications actions table includes the following columns:
- Ontology: Represents the Ontology class, encompassing both objects and classifications. For classifications, you can expand to view statistics for each classification answer.
- Created: Displays the total number of instances created for this Ontology class. Each instance is counted only once, ensuring that resubmissions of the same label are not double-counted.
- Approved: Displays the total number of instances of this Ontology class that have been approved. Approvals are counted multiple times if a label is approved in multiple review stages or if the task is reopened and reviewed again. Use stage-specific filters to see approvals per review stage.
- Rejected: Displays the number of instances of this Ontology class that have been rejected. Rejections are double-counted if a label is rejected in multiple review stages, rejected again within the same stage, or if the task is reopened and rejected again. Use stage-specific filters to see rejections per review stage.
- Rejection Rate: Calculates the rejection rate percentage of the given Ontology class by dividing the number of rejected labels by the total number of reviewed labels.
Collaborators
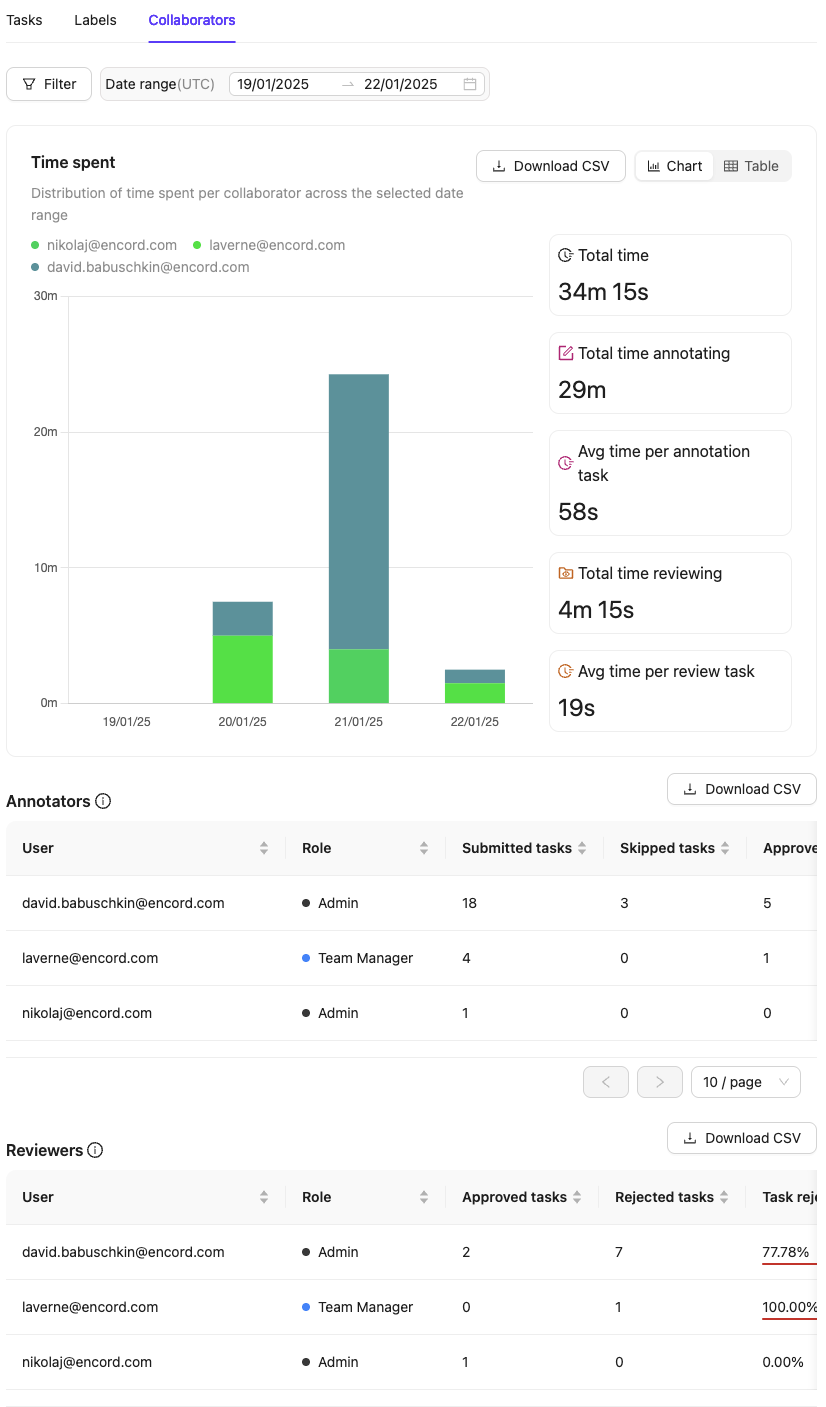
- How much time did each collaborator spend on annotation / review tasks?
- Use the Time spent chart to see the time distribution for each collaborator across annotation and review tasks. The Annotators and Reviewers tables, which provide total and average times for each collaborator.
- Which collaborator spent the most time annotating or reviewing tasks in the Project?
- Analyze the Time spent chart to identify the collaborator with the highest time allocation.
- Labels refer to objects and classifications.
- Approve actions are double counted if there are multiple review stages.
- Review actions are double counted if multiple review stages are present or tasks get rejected again in the same review stage.
Both tables and all CSV exports are filter-sensitive; they only display information within the selected filter conditions.
Instance Labels
Instance Labels
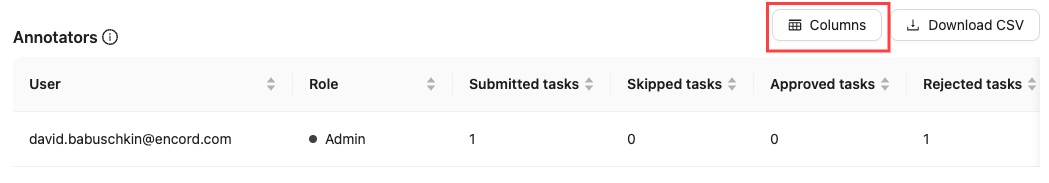
The Annotators table includes the following columns:
- Submitted tasks: Total tasks submitted by the annotator.
- Skipped tasks: Total tasks skipped by the annotator.
- Approved tasks: Tasks submitted by the annotator that were approved in subsequent review stages.
- Rejected tasks: Tasks submitted by the annotator that were rejected during review.
- Task rejection rate: Percentage of the annotator’s submitted tasks that were rejected. If multiple review stages are present, use workflow filters to view stage-specific rejections.
- Created labels: Total new labels submitted by the annotator. Include any pre-labels imported using the SDK by admins.
- Edited labels: Total existing labels edited by the annotator. This includes pre-labels from an Agent stage, or labels from a previous Annotate stage. Vertex / coordinate changes are not tracked.
- Deleted labels: Total existing labels deleted by the annotator. This includes pre-labels from an Agent stage, or labels from a previous Annotate stage.
- Approved labels: Labels submitted by the annotator that were approved during review.
- Rejected labels: Labels submitted by the annotator that were rejected during review.
- Label rejection rate: Percentage of the annotator’s submitted labels that were rejected during review.
- Total annotation time: Total active time spent annotating in the Label Editor, rounded to the nearest second.
- Avg time per task: Average time spent on each submitted annotation task. Calculated using the total active time spent in the Annotate stage divided by the number of submitted tasks.
- Issue actions against user: The number of Issue actions taken against the user.
- Approved tasks: Number of tasks approved by the reviewer.
- Rejected tasks: Number of tasks rejected by the reviewer.
- Task rejection rate: Percentage of reviewed tasks that were rejected by the reviewer.
- Created labels: Total labels created by the reviewer using Edit Review.
- Edited labels: Total labels edited by the reviewer using Edit Review.
- Deleted labels: Total labels deleted by the reviewer using Edit Review.
- Approved labels: Number of labels approved by the reviewer.
- Rejected labels: Number of labels rejected by the reviewer.
- Total review time: Total active time spent reviewing in the Label Editor, rounded to the nearest second.
- Avg time per label: Average time spent on each reviewed label. Calculated using the total active time spent in the Review stage divided by the number of reviewed labels.
- Avg time per task: Average time spent on each actioned review task. Calculated using the total active time spent in the Review stage divided by the number of actioned reviews.
- Issue actions by user: The number of Issue actions taken by the user.
Frame Labels
Frame Labels
The Annotators table includes the following columns:
- Submitted tasks: Total tasks submitted by the annotator.
- Skipped tasks: Total tasks skipped by the annotator.
- Approved tasks: Tasks submitted by the annotator that were approved in subsequent review stages.
- Rejected tasks: Tasks submitted by the annotator that were rejected during review.
- Task rejection rate: Percentage of the annotator’s submitted tasks that were rejected. If multiple review stages are present, use workflow filters to view stage-specific rejections.
- Created frame labels: Total new labels submitted by the annotator. Include any pre-labels imported using the SDK by admins.
- Edited frame labels: Total existing labels edited by the annotator. This includes pre-labels from an Agent stage, or labels from a previous Annotate stage. Vertex / coordinate changes are not tracked.
- Deleted frame labels: Total existing labels deleted by the annotator. This includes pre-labels from an Agent stage, or labels from a previous Annotate stage.
- Approved frame labels: Labels submitted by the annotator that were approved during review.
- Rejected frame labels: Labels submitted by the annotator that were rejected during review.
- Frame label rejection rate: Percentage of the annotator’s submitted labels that were rejected during review.
- Total annotation time: Total active time spent annotating in the Label Editor, rounded to the nearest second.
- Avg time per task: Average time spent on each submitted annotation task. Calculated using the total active time spent in the Annotate stage divided by the number of submitted tasks.
- Approved tasks: Number of tasks approved by the reviewer.
- Rejected tasks: Number of tasks rejected by the reviewer.
- Task rejection rate: Percentage of reviewed tasks that were rejected by the reviewer.
- Created frame labels: Total labels created by the reviewer using Edit Review.
- Edited frame labels: Total labels edited by the reviewer using Edit Review.
- Deleted labels: Total labels deleted by the reviewer using Edit Review.
- Approved frame labels: Number of labels approved by the reviewer.
- Rejected frame labels: Number of labels rejected by the reviewer.
- Total review time: Total active time spent reviewing in the Label Editor, rounded to the nearest second.
- Avg time per frame label: Average time spent on each reviewed label. Calculated using the total active time spent in the Review stage divided by the number of reviewed frame labels.
- Avg time per task: Average time spent on each actioned review task. Calculated using the total active time spent in the Review stage divided by the number of actioned reviews.
Issues
The Issues tab in the Analytics dashboard provides a detailed view of all issues created in the Project.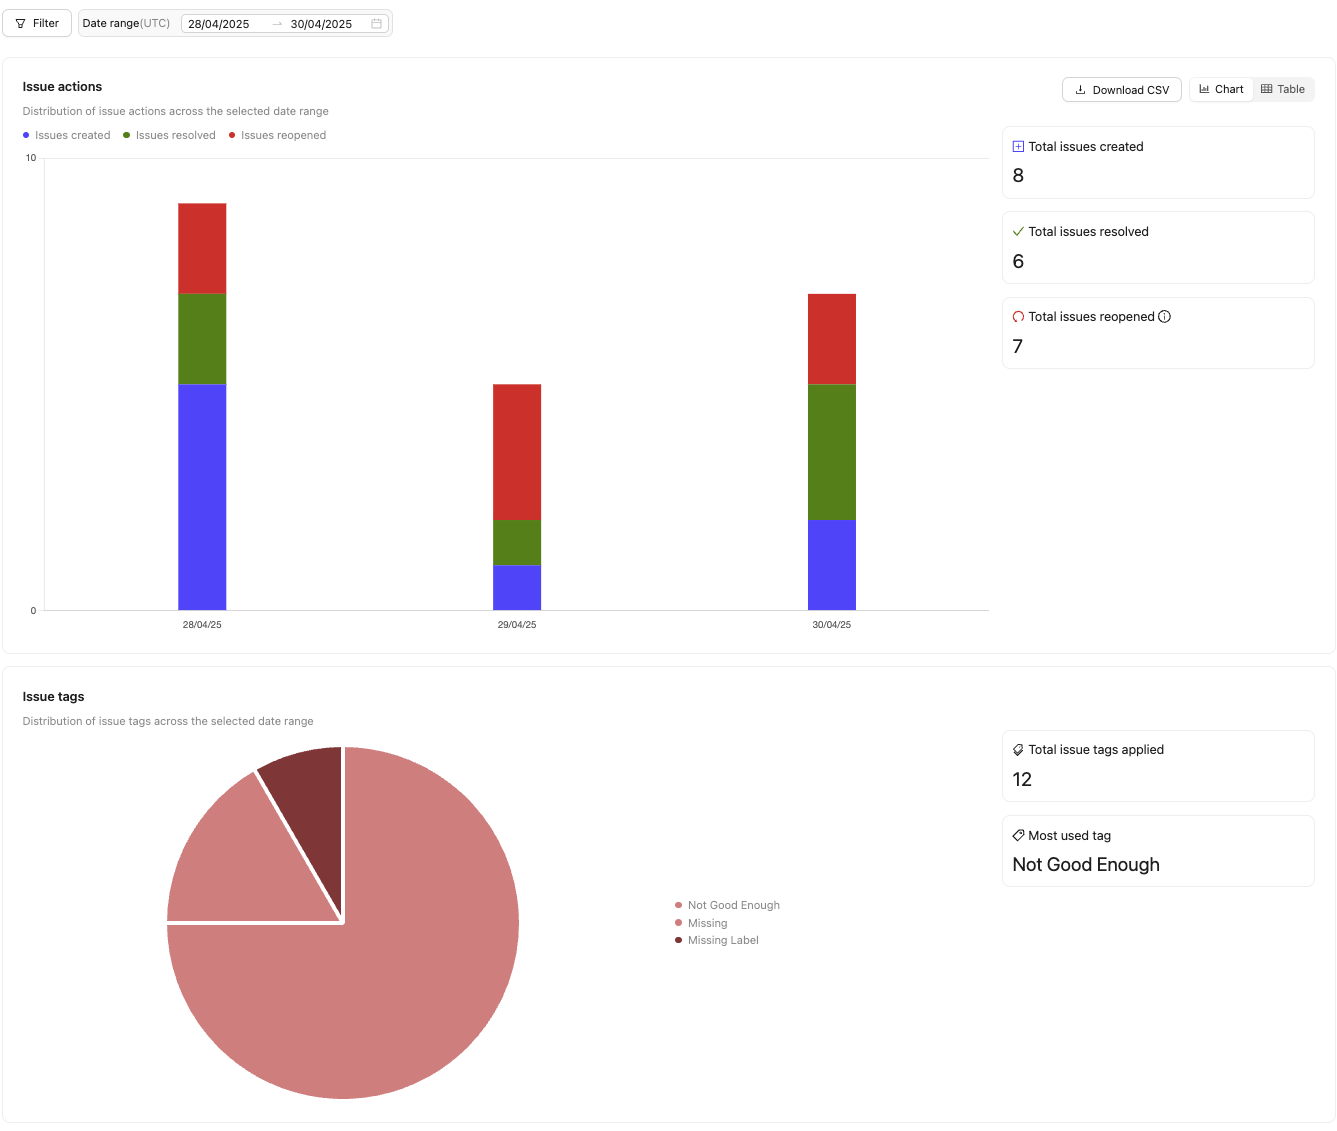
The Issue actions chart shows the following:
- Total issues created: The total number of issues created.
- Total issues resolved: The number of issues marked as resolved.
- Total issues reopened: The number of issues that were reopened.
- Total issues created = 19
- Total issues resolved = 20
- Total issues reopened = 2
- 19 issues were created.
- All 19 issues were resolved.
- 2 resolved issues were reopened. (This includes manually reopening an issue and re-rejections of labels)
- 1 of the reopened issues was resolved.
- There is one remaining open issue.
Agents
The Agents tab in the Analytics dashboard provides a detailed view of all Agents run in the Project.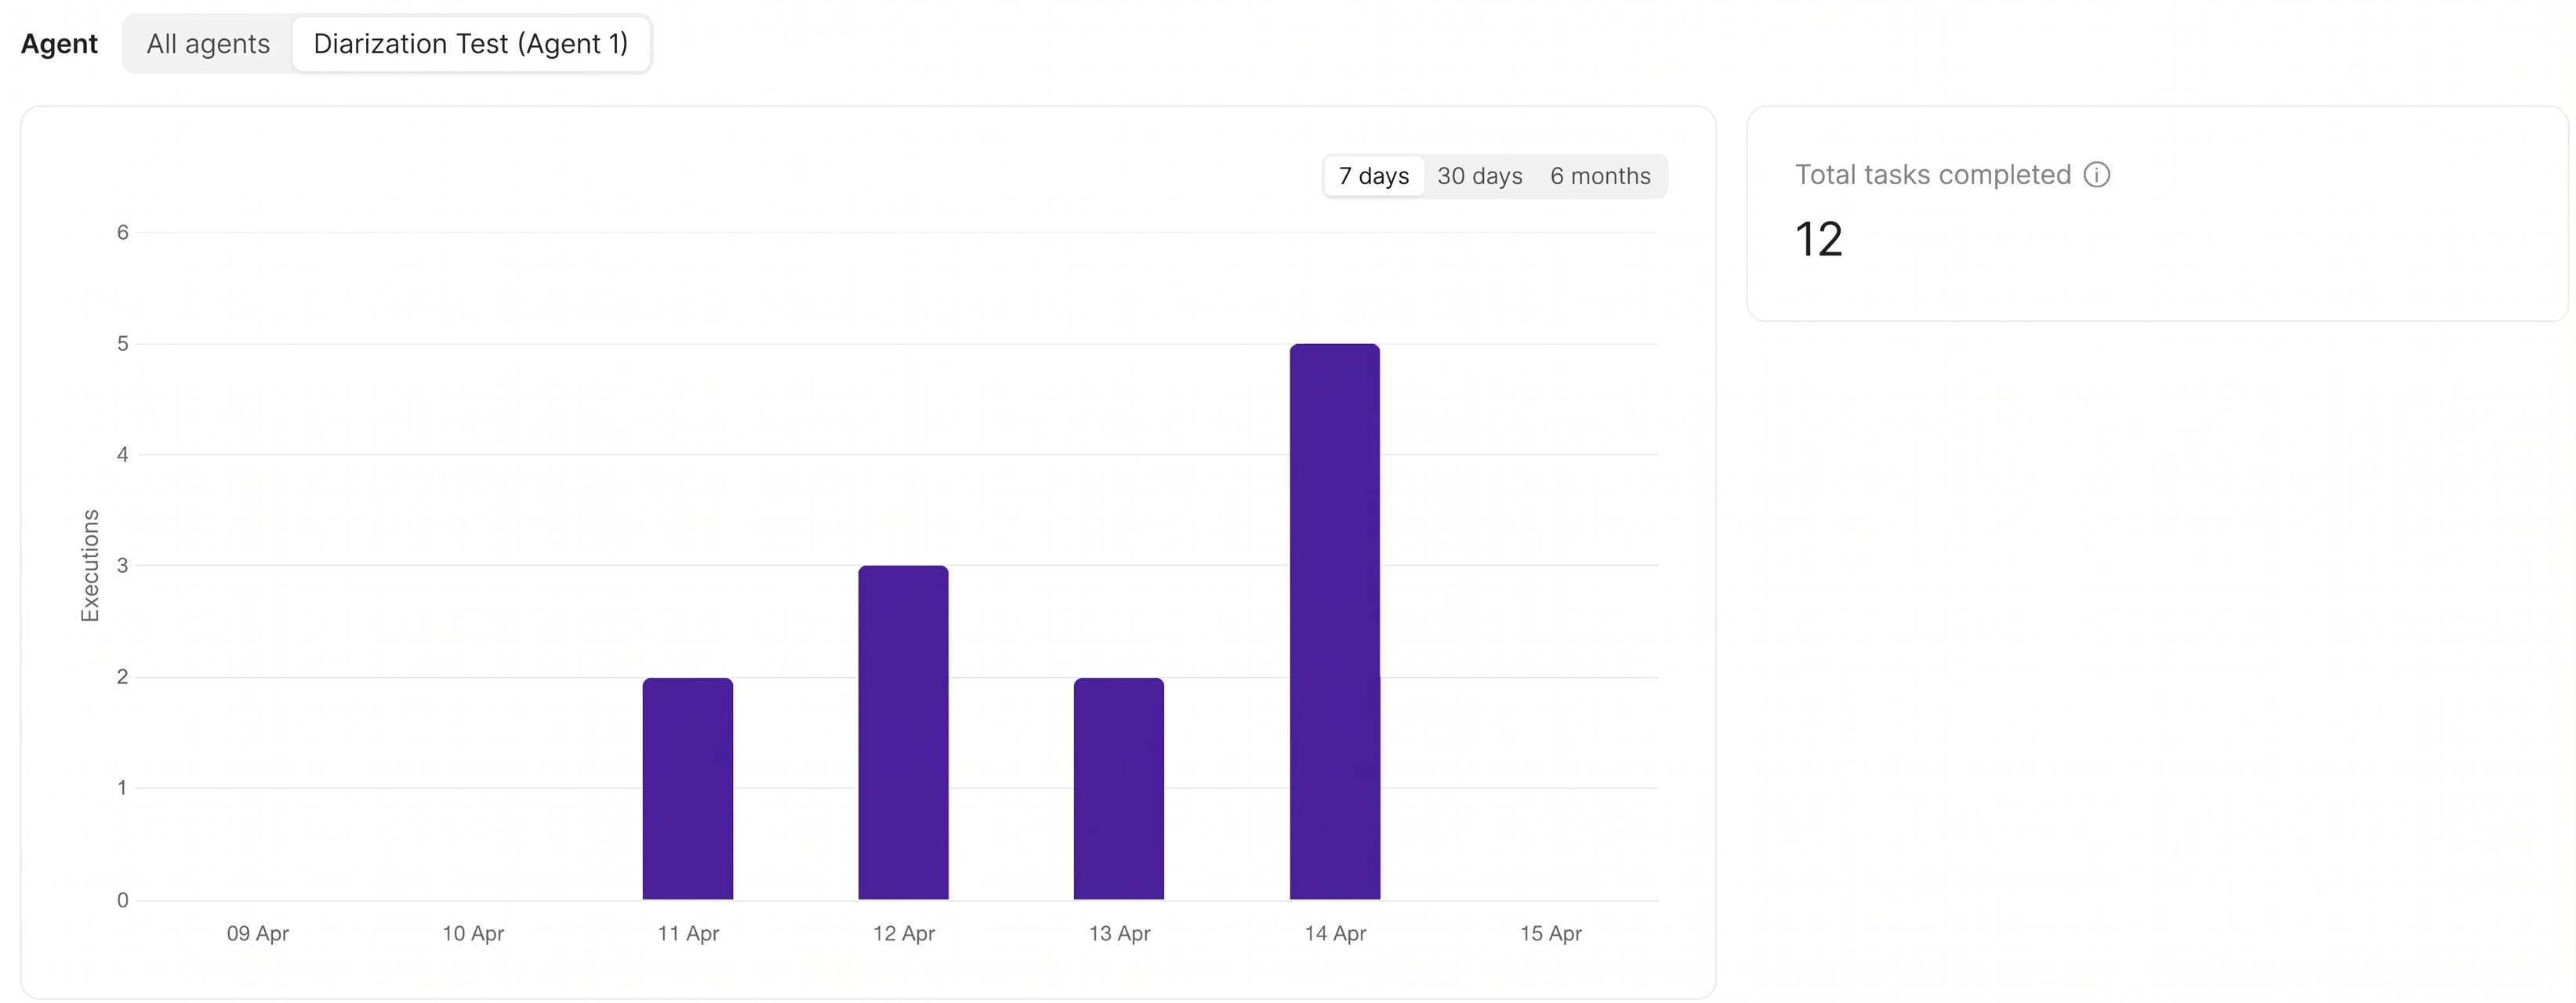
Analytics FAQ
How do I track annotator performance on pre-labeling/model labels?Annotator performance on pre-labeled or model-generated labels can be tracked using the Edited Labels and Deleted Labels metrics in the Annotators table. These include:
- Labels that were pre-labeled using an Agent stage.
- Labels that were modified by annotators during the annotation process.
Can I export analytics for payroll or performance tracking?
Yes, CSV exports from the Analytics tab provide data that can be used for payroll or performance tracking.
- The Annotators and Reviewers tables contain total time spent, tasks submitted, approved, and rejected.
- Data in exports is filter-sensitive, so you can apply filters before exporting.
- Review time is rounded to the nearest second per task.
What is counted as a created label?
A created label is any new label added by an annotator or reviewer. This includes:
- A completely new label drawn or added during annotation.
- Labels created in Edit Review mode.
- Labels submitted using the SDK (counted under the annotator who submitted the task).
What is counted as an edited label?
An edited label is a modification made to an existing label. This includes:
- Changes to attributes or classifications.
- Labels modified from pre-labeling or a previous annotation stage.
Changes to vertices/coordinates alone do not count as an edit.
Can I customize what data is included in the CSV exports?
No, CSV exports are pre-defined and contain all available metrics. However, you can filter the data before exporting to limit what is included.
How are timers tracked?
Timers track active time spent in the Label Editor:
- Time is rounded to the nearest second per task.
- Pauses or inactivity do not count toward the active time.
- The
Avg time per taskmetric is calculated by dividing the total annotation/review time by the number of submitted tasks.
Are label events counted if a task is skipped?
No. If a task is skipped, any actions performed before skipping (for example, creating/editing labels) are not recorded in the Analytics dashboard.
How are actions outside of the task queue counted?
Actions performed outside of the task queue, such as label modifications using the SDK are only tracked if the task is subsequently submitted, rejected, or approved.
How does the SDK filter work?
The Event Source filter allows you to view actions performed using the SDK or UI.
What happens if someone is inactive or takes a break?
- Inactive time is not recorded. The system only tracks time when the annotator is actively working in the Label Editor.
- If an annotator takes a break without closing the task, their session remains open, but inactive time is not counted.
How long does it take for actions to appear on the Analytics dashboard?
- It takes a maximum of 5 minutes for any action to appear on the Analytics dashboard.
What summary cards appear on the Project Overview tab?
The Project Overview tab displays a set of summary cards that give you a quick snapshot of Project health:
- Tasks completed — shows the number of completed tasks out of the total, with a Project status selector in the footer.
- Time spent — shows the total active time spent in the Label Editor across all collaborators. Click Show breakdown to go directly to the Collaborators tab in Analytics.
- Opened issues — shows the number of currently open issues. Click Show tasks to open the task queue filtered to tasks with unresolved issues.
All stat cards and the Class distribution and Top issue tags cards are hidden for labeling-services-only Projects.
How do the Class Distribution and Top Issue Tags cards on the Project Overview relate to the Analytics tab?
The Class distribution and Top issue tags cards on the Project Overview tab display summary analytics drawn from the same data as the full Analytics tab. Each card includes a Show analytics link that takes you directly to the corresponding sub-tab. Encord hides the Show analytics link when a card has no data to display.
- The Class distribution card links to the Labels sub-tab, where you can explore per-class label counts, approval rates, and rejection rates in detail. The card shows the top 5 and bottom 5 classes by label count. The subtitle displays the total number of label instances.
- The Top issue tags card links to the Issues sub-tab, where you can view issue tag occurrence charts and full issue action history. The card shows up to 10 issue tags ranked by frequency, with amber-colored bars. The subtitle displays the total number of issue tags created.
Tag bar counts on the Top issue tags card reflect tag-action totals (including re-rejections), not unique issue counts. The count for untagged issues is a frontend approximation and may under-report when untagged issues exist.
What happens when there are no labels or issue tags yet?
Each card displays an informational empty state when no data is available:
- The Class distribution card displays “Instance labels by class will appear here.”
- The Top issue tags card displays “Most common issue tags will appear here” and includes a Setup issue tags link to the issue tag settings so you can configure tags before annotation begins.
Can I navigate to a specific Workflow stage queue from the Project Overview?
Yes. The Workflow mini-map on the Project Overview tab displays your Project’s Workflow stages as interactive nodes. Clicking an annotation, review, or other queue-type stage node navigates you directly to the Queue tab, pre-filtered to that stage.
- A pointer cursor appears when you hover over a clickable stage node.
- Start, Percentage Router, and User Router nodes are not clickable and do not link to the queue.
What happens to the analytics view when I click Preview on the Task layout card?
Clicking Preview on the Task layout card in the Project Overview left panel replaces the right-panel analytics content — including the task-status chart and stat cards — with an embedded label editor preview. The analytics view returns when you click Close preview in the preview panel header.
The Preview button is disabled when the Project has no demo data and no linked datasets. Link at least one dataset to the Project to enable the preview.
Who can see the Manage and Configure buttons on the Data Overview card?
The Manage and Configure buttons on the Data Overview card in the Project Analytics Overview are only visible to Workspace Admins and Project Admins.