Documentation Index

Fetch the complete documentation index at: https://docs.encord.com/llms.txt

Use this file to discover all available pages before exploring further.

Filters

You can refine searches by data quality metrics, Collections, custom metadata, folders, data titles, and data types. Collections: Collections are a way to save interesting groups of data units and labels, to support and guide your downstream workflow. Custom Metadata: Custom metadata added to data units. The custom metadata added to data units in Folders persists to Annotate Projects and Active.
For information on importing custom metadata, refer to Adding Metadata in the documentation.
Data title: The file name of the image or video. Data Types: Data, labels, and Predictions can be filtered by: images, image sequences, image groups, and videos. File ID: The unique hash assigned to the image or video when it imports into Encord. Folder: The Folder images or videos reside in. Integration: The integration (if any) your images/videos reside in. Keyframe: Frames of interest you specified on your videos. MIME type: Also known as media type. The file type of an image or video. For example, video/mp4. Storage location: The location where your images/videos reside. Examples include AWS, GCP, Local. Uploaded at: The date and time that the image/video uploaded. To filter data:
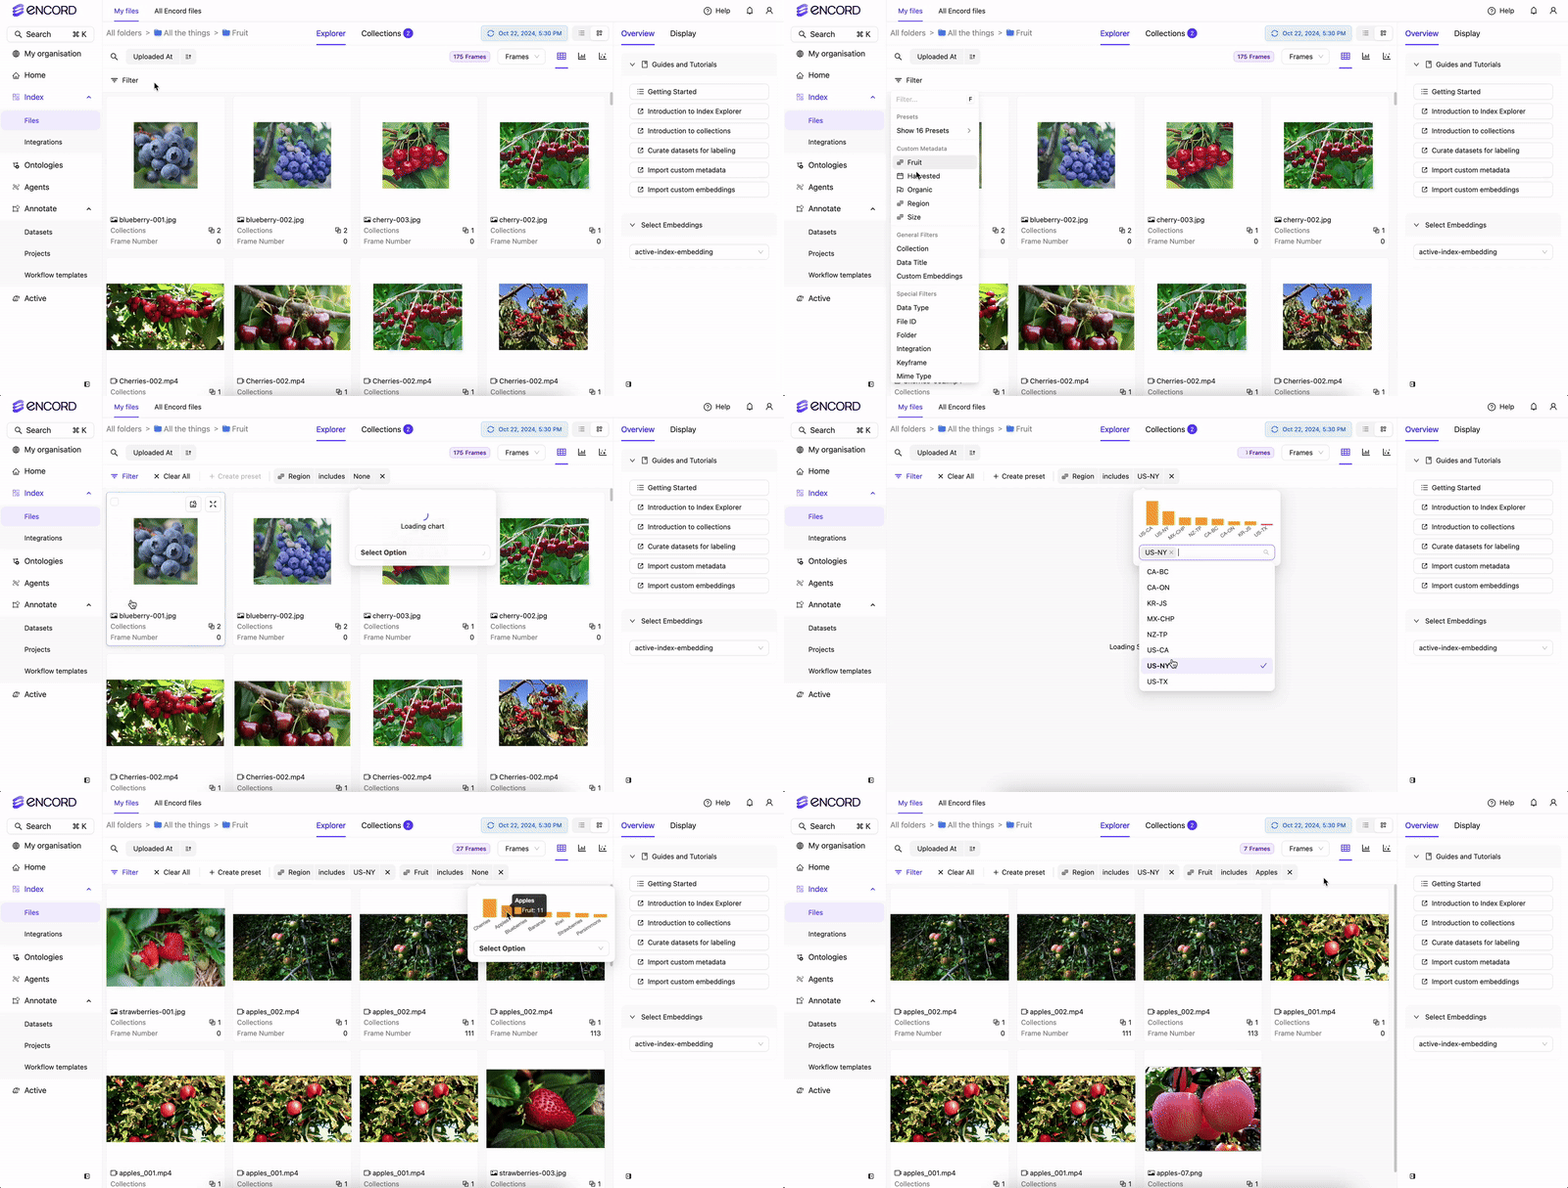
  1. Navigate to Data > Explore and select a folder.
  2. Click the Filter dropdown or press F. Index Filtering
  3. Add and configure the filters you need.

Preset Filters

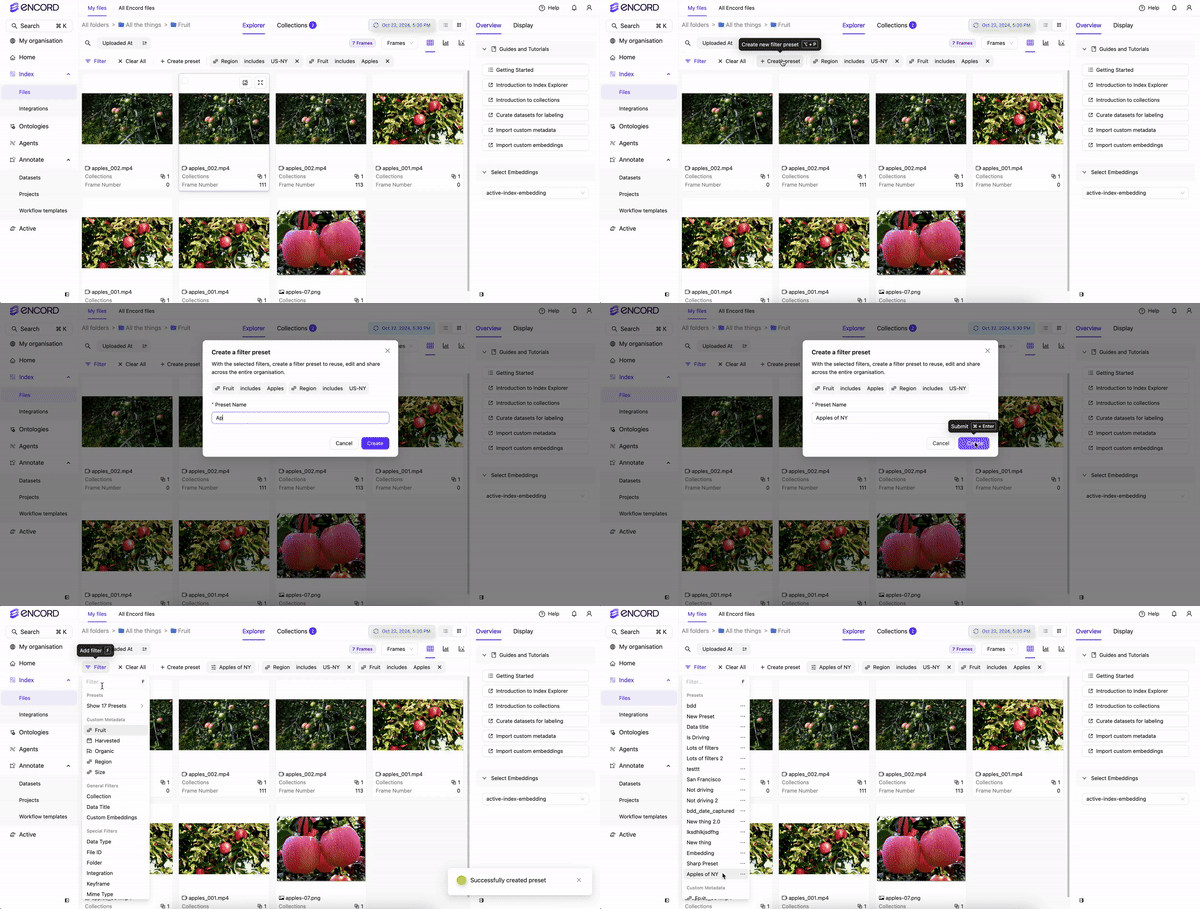
Preset filters let you save and reuse filtering criteria across your workspace. Since presets are available everywhere during data curation, some may return no results in certain contexts. For example, a preset scoped to Folder A will return nothing when browsing Folder B if Folder A isn’t a subfolder of it. To create a Preset filter:
  1. Navigate to Data > Explore and select a folder.
  2. Click the Filter dropdown or press F.
  3. Add and configure the filters you need. Index Filtering
  4. Click +Create preset and give the preset a name.
  5. Click Create to finish creating the preset. Create Presets
To use an existing Preset:
  1. Navigate to Data > Explore and select a folder.
  2. Click the Filter dropdown or press F.
  3. Select the Preset you want to use from the dropdown. All presets are listed at the top of the list oif filters.
Global filters apply to any Folder, but Local filters only apply on the Folder where the Preset was created.

Sorting

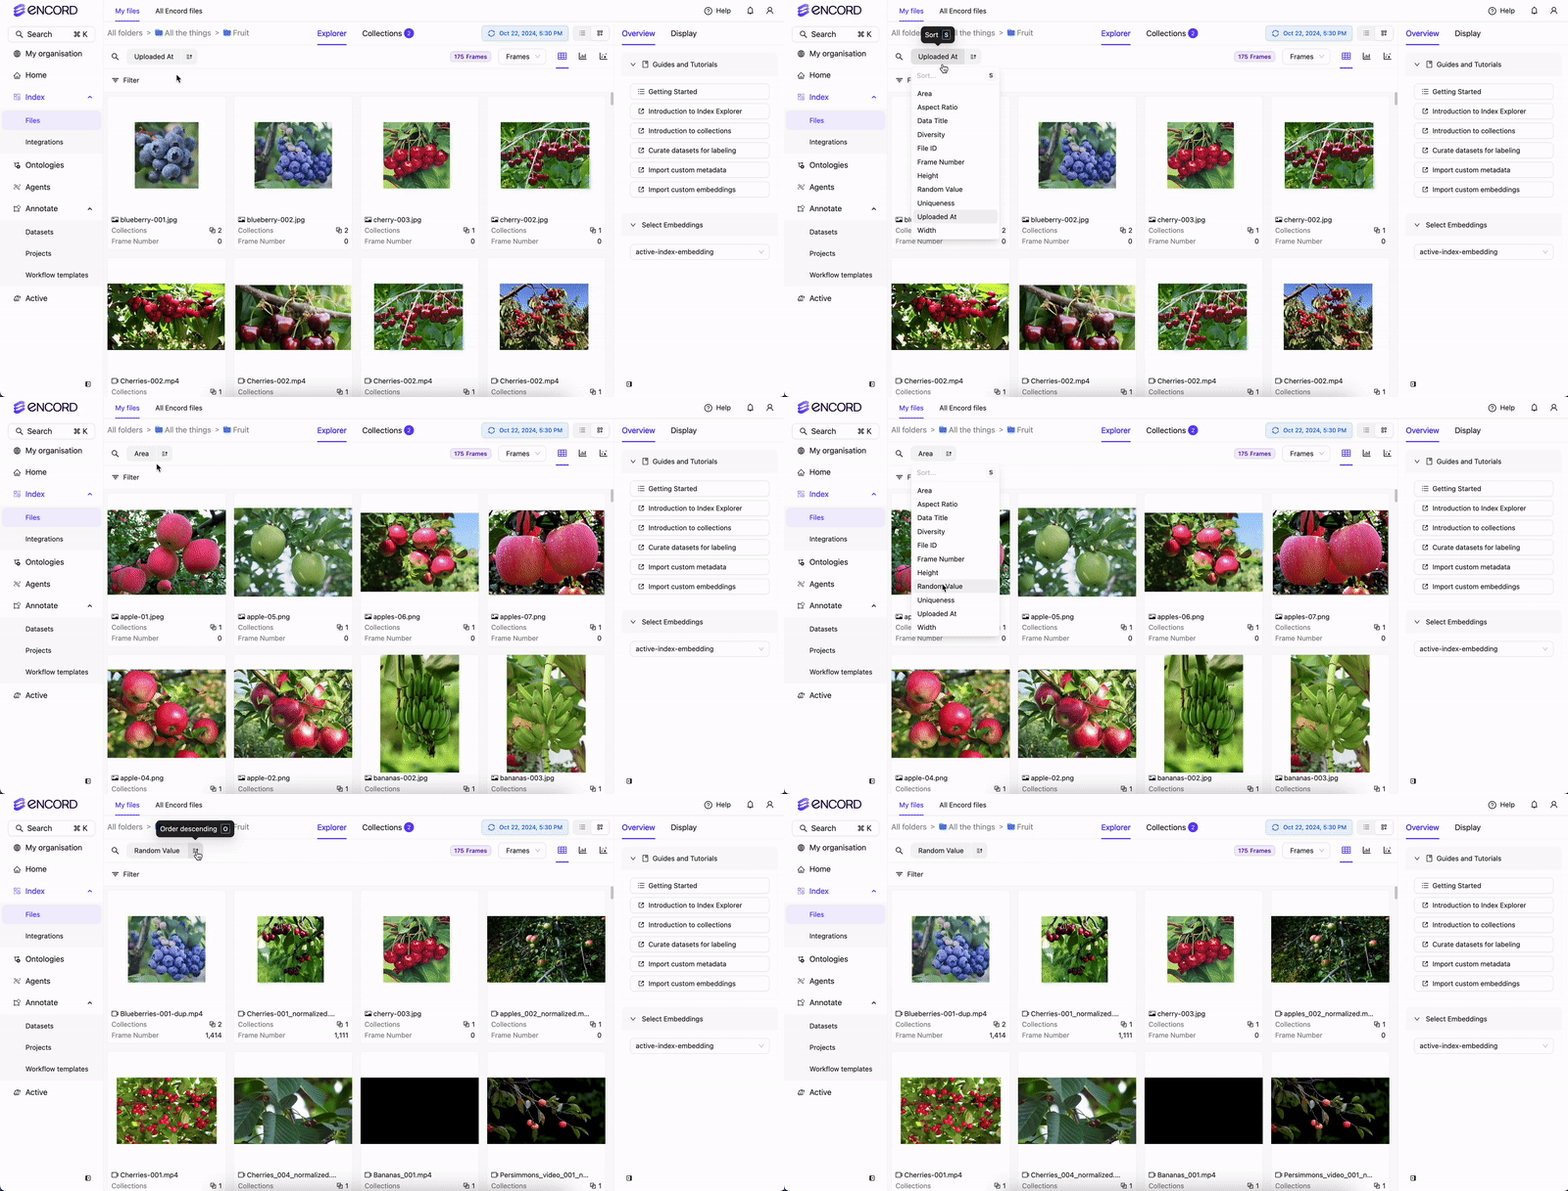
Sort your data, in ascending or descending order, using data quality metrics. To sort your data:
  1. Navigate to Data > Explore and select a folder.
  2. Select the metric to sort the data. Index Sort
  3. Specify ascending or descending order.
  • Filter and use the natural language searches to further help get the results you want.
  • After filtering, sorting, and searching, create a Collection.

Quality Metrics

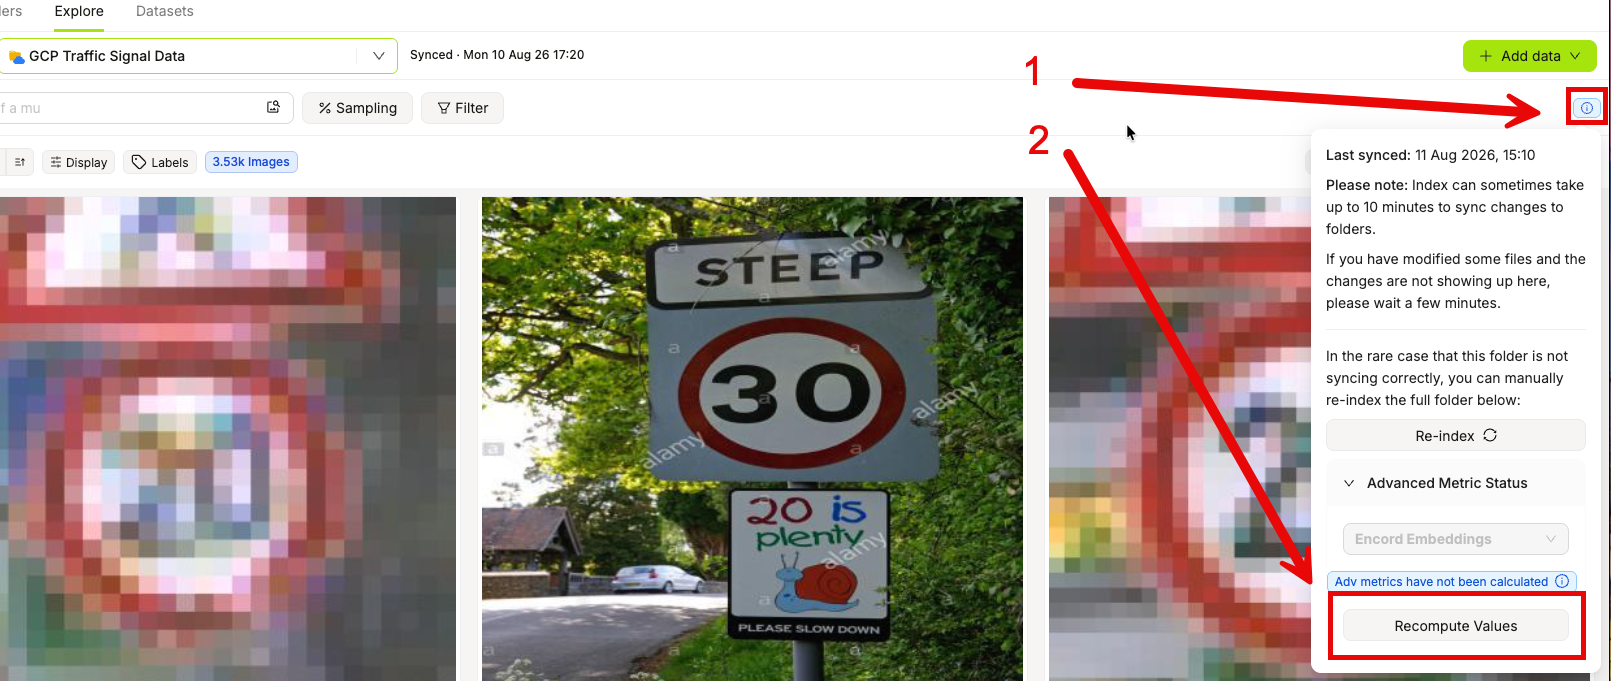
Quality metrics are only calculated when you upgrade your folder. If you don’t see the quality metrics during curation, make sure to upgrade your folder.
Quality metrics evaluate your data, labels, and model predictions, forming the foundation of effective data curation. They provide meaningful ways to surface, rank, and explore your data — helping you identify issues, spot patterns, and make informed decisions about what to curate, fix, or prioritize. Video Quality Metrics: Video quality metrics must be calculated by upgrading your folder. Examples include Area, Clip duration, Frames per second, Number of frames. Data Quality Metrics: Data quality metrics must be calculated by upgrading your folder. Examples include Area, Frame number, Random value.
For more detailed information on Data Quality Metrics, refer to the Data Quality Metrics documentation.
TitleMetric TypeOntology Type
Area - Ranks images by their area (width/height).image
Aspect Ratio - Ranks images by their aspect ratio (width/height).image
Blue Value - Ranks images by how blue the average value of the image is.image
Brightness - Ranks images by their brightness.image
Contrast - Ranks images by their contrast.image
Diversity - Forms clusters based on the Ontology and ranks images from easy samples to annotate to hard samples to annotate.image
Frame Number - Selects images based on a specified range.image
Green Value - Ranks images by how green the average value of the image is.image
Height - Ranks images by the height of the image.image
Object Count - Counts number of objects in the image.imagebounding box, checklist, point, polygon, polyline, radio, rotatable bounding box, skeleton, text
Object Density - Computes the percentage of image area that is occupied by objects.imagebounding box, polygon, rotatable bounding box
Randomize Images - Assigns a random value between 0 and 1 to images.image
Red Value - Ranks images by how red the average value of the image is.image
Sharpness - Ranks images by their sharpness.image
Uniqueness - Finds duplicate and near-duplicate images.image
Width - Ranks images by the width of the image.image
Label Quality Metrics are used for sorting data, filtering data, and data analytics.
TitleMetric TypeOntology Type
Absolute Area - Computes object size in amount of pixels.imagebounding box, polygon, rotatable bounding box
Aspect Ratio - Computes aspect ratios of objects.imagebounding box, polygon, rotatable bounding box
Blue Value - Ranks annotated objects by how blue the average value of the object is.imagebounding box, polygon, rotatable bounding box
Border Proximity - Ranks annotations by how close they are to image borders.imagebounding box, point, polygon, polyline, rotatable bounding box, skeleton
Brightness - Ranks annotated objects by their brightness.imagebounding box, polygon, rotatable bounding box
Broken Object Tracks - Identifies broken object tracks based on object overlaps.sequence, videobounding box, polygon, rotatable bounding box
Classification Quality - Compares image classifications against similar images.imageradio
Confidence - The confidence that an object was annotated correctly.imagebounding box, polygon, rotatable bounding box
Contrast - Ranks annotated objects by their contrast.imagebounding box, polygon, rotatable bounding box
Green Value - Ranks annotated objects by how green the average value of the object is.imagebounding box, polygon, rotatable bounding box
Height - Ranks annotated objects by the height of the object.imagebounding box, polygon, rotatable bounding box
Inconsistent Object Class - Looks for overlapping objects with different classes across frames.sequence, videobounding box, polygon, rotatable bounding box
Inconsistent Track ID - Looks for overlapping objects with different track IDs across frames.sequence, videobounding box, polygon, rotatable bounding box
Label Duplicates - Ranks labels by how likely they are to represent the same object.imagebounding box, polygon, rotatable bounding box
Missing Objects - Identifies missing objects based on object overlaps.sequence, videobounding box, polygon, rotatable bounding box
Object Classification Quality - Compares object annotations against similar image crops.imagebounding box, polygon, rotatable bounding box
Occlusion Risk - Tracks objects and detects outliers in videos.sequence, videobounding box, rotatable bounding box
Polygon Shape Anomaly - Calculates potential outliers by polygon shape.imagepolygon
Randomize Objects - Assigns a random value between 0 and 1 to objects.imagebounding box, polygon, rotatable bounding box
Red Value - Ranks annotated objects by how red the average value of the object is.imagebounding box, polygon, rotatable bounding box
Relative Area - Computes object size as a percentage of total image size.imagebounding box, polygon, rotatable bounding box
Sharpness - Ranks annotated objects by their sharpness.imagebounding box, polygon, rotatable bounding box
Width - Ranks annotated objects by the width of the object.imagebounding box, polygon, rotatable bounding box
TitleMetric TypeOntology Type
Area - Ranks videos by their area (width/height).video
Aspect Ratio - Ranks videos by their aspect ratio (width/height).video
Blue Value - Ranks videos by how blue the average value of the video is.video
Brightness - Ranks videos by their brightness.video
Clip Duration - Ranks videos based on the video’s duration.video
Contrast - Ranks videos by their contrast.video
Diversity - Forms clusters based on the ontology and ranks videos from easy samples to annotate to hard samples to annotate.video
Frame Number - Selects videos based on a specified range.video
Frame Label Countvideo
Frames Per Secondvideo
Green Value - Ranks videos by how green the average value of the video is.video
Height - Ranks videos by the height of the video.video
Instance Label Count - Ranks videos by the number of unique objects in the video.videobounding box, checklist, point, polygon, polyline, radio, rotatable bounding box, skeleton, text
Red Value - Ranks videos by how red the average value of the video is.video
Sharpness - Ranks videos by their sharpness.video
Uniqueness - Finds duplicate and near-duplicate videos.video
Unlabelled Frames (%) - Ranks videos based on the percentage of unlabelled frames in the video.video
Unlabelled Frames (#) - Ranks videos based on the number of unlabelled frames in the video.video
Width - Ranks videos by the width of the video.video
Model quality metrics help you evaluate your data and labels based on a trained model and imported model predictions.Acquisition FunctionsAcquisition functions are a special type of model quality metric, primarily used in active learning to score data samples according to how informative they are for the model, enabling smart labeling of unannotated data.
TitleMetric TypeData Type
Entropy - Ranks images by their entropy.image
Least Confidence - Ranks images by their least confidence score.image
Margin - Ranks images by their margin score.image
Variance - Ranks images by their variance.image
Mean Object Score - Ranks images by their average object score.imageobject
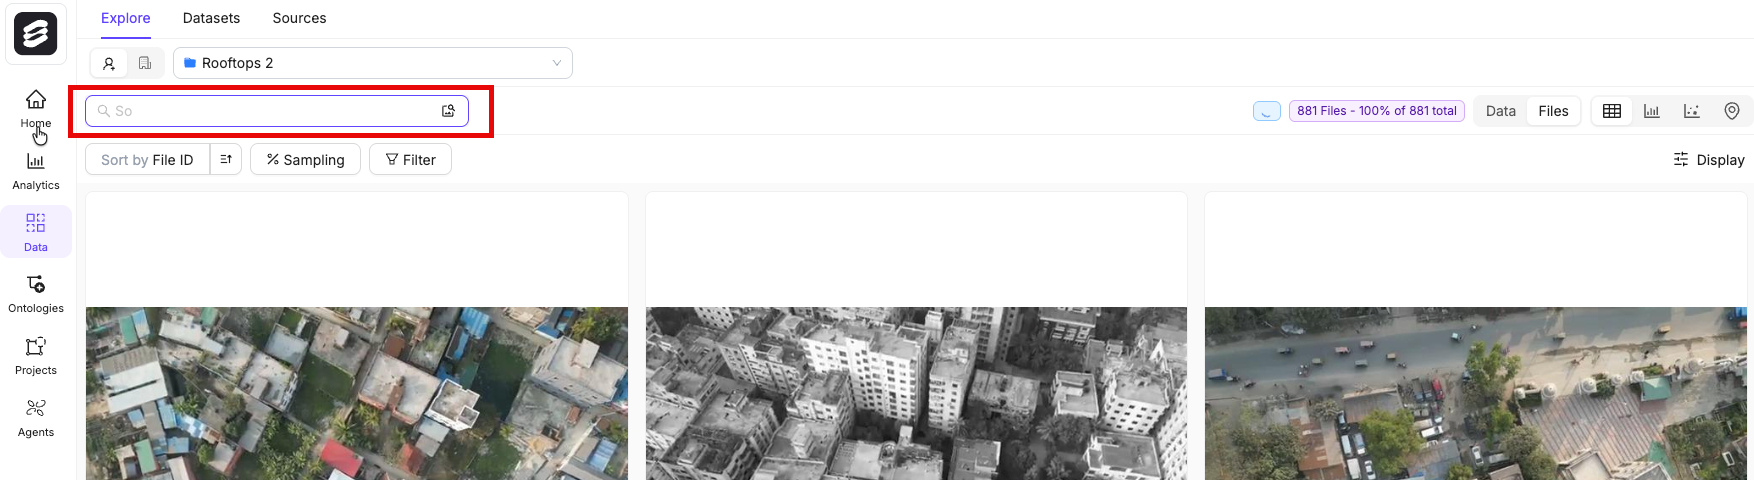
Natural language search and similarity search can only be performed after you upgrade your folder.
To use natural language or image search:
  1. Navigate to Data > Explore and select a folder.
  2. Type a search query or upload an image.
Natural Language Search

Collections

Collections provide a way to save interesting groups of data units and labels, to support and guide your downstream workflow. By grouping your data into Collections you are able to:
  • Save data units or labels, individually or in bulk, into new or existing collections.
  • Curate higher-quality data collections for annotation, creating and grouping a range of different data units or labels into collections for better overview, data management, and structure.
To create or edit a Collection:
  1. Select the data you want to add to a collection by clicking the checkbox on the data card.
  2. Click Actions or press A.
  3. Select Add to collection.
  4. Select +New Collection to create a new collection, or Existing Collection to add the data to an existing collection.
  5. Click Submit.
To export a Collection as a CSV file:
  1. Click Filter or press F.
  2. Click the ellipsis icon next to the collection you want to export.
  3. Click Download CSV.

Folder Upgrade

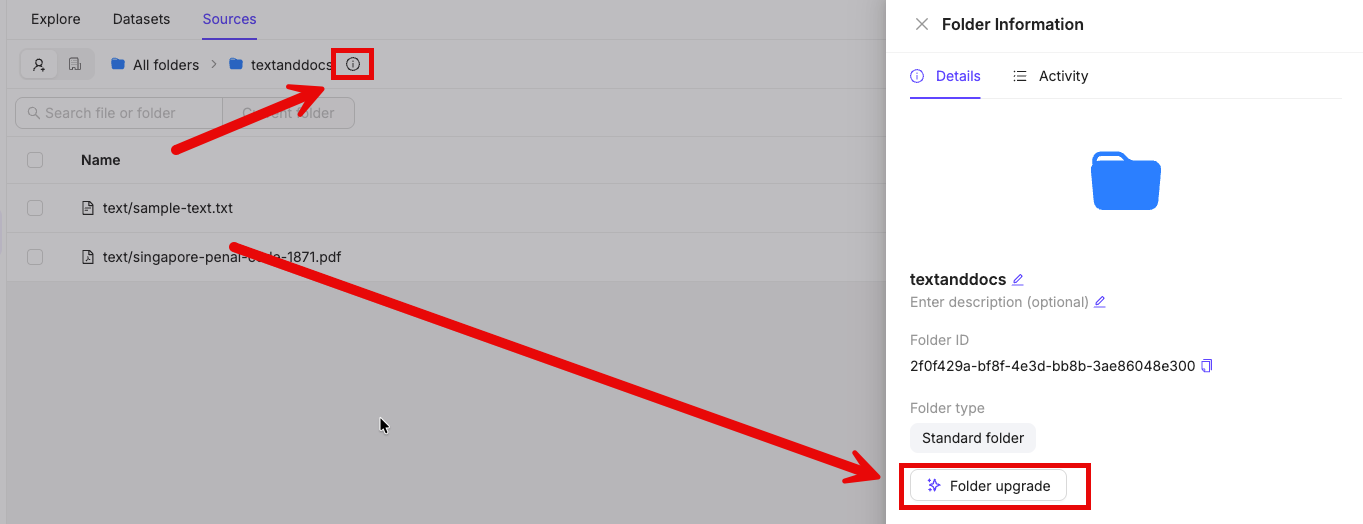
After you data is added into Encord you can upgrade the storage folder that your data resides in. Upgrading your folder calculates quality metrics, generates data embeddings, and enables features like natural language search and embedding plots to support your data curation. To upgrade your folder:
  1. Navigate to Data > Sources.
  2. Click into the folder
  3. Click the info icon next to the folder name
  4. Click Folder upgrade.