Issues End-to-End Guide

This guide explains how to use the Issues feature in Encord. Each step in the process is intended for a specific user role, which is indicated in the heading of that step.
This guide assumes you have already added data into Encord and set up your annotation Projects.

STEP 1: [Workspace Admin] Create Issue Tags

Issue tags can be created in the Workspace Settings by Workspace admins, or the Project Settings by Project admins.
For more information, refer to our Issue Tags documentation.
Issue tags serve as a system to categorize, group, and filter issues within Projects.
  1. Click Settings in the My workspace section. The Users page appears.
  2. Navigate to the Issue Tags tab. The Issue Tags page appears.
  3. Click + New issue tag to create a new issue tag for your Workspace.
  1. Give your Issue Tag a meaningful name and press ENTER to create the Issue Tag.
  2. Repeat Steps 3 and 4 to create as many Issue Tags as necessary.

Delete Issue Tags

You can delete issue tags individually or in bulk: To delete a single issue tag:
  1. Click the delete icon next to the issue tag you want to remove.
  2. Confirm the deletion when prompted.
To delete multiple issue tags:
  1. Select the checkboxes next to the issue tags you want to delete.
  2. Click the Delete selected button that appears.
  3. Confirm the bulk deletion when prompted.
Deleting issue tags is permanent and cannot be undone. Ensure you no longer need these tags before proceeding.

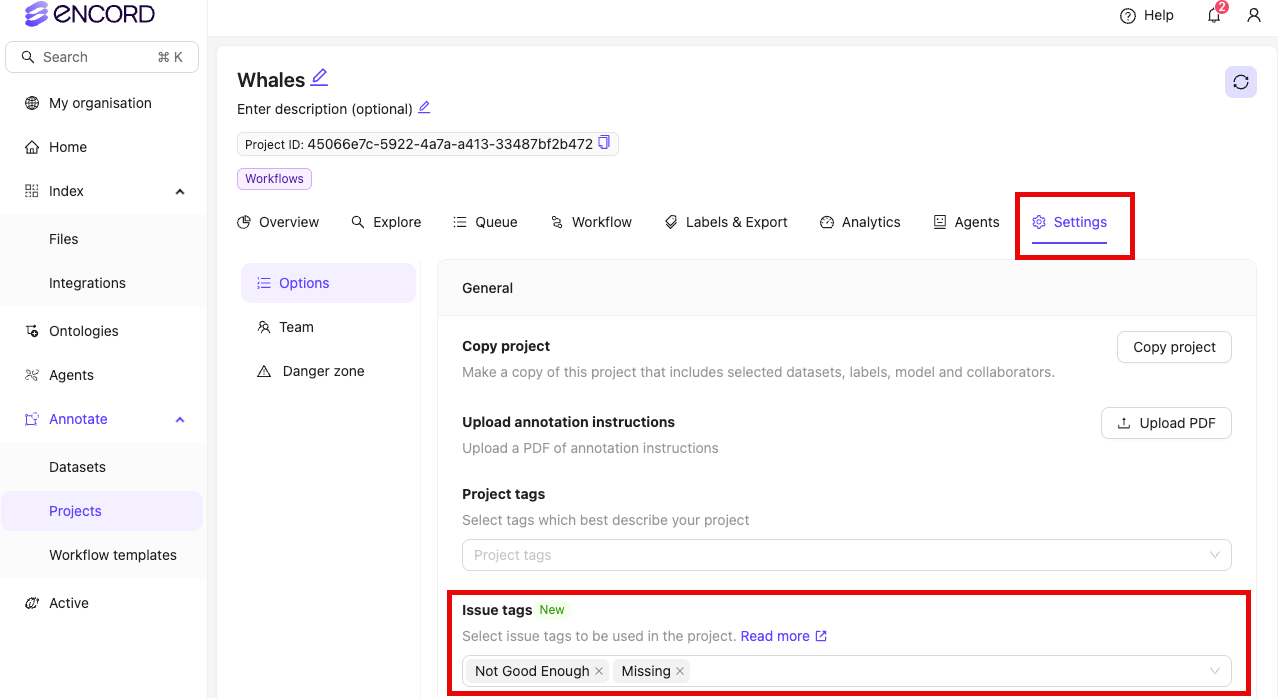
STEP 2: [Admin] Add Issue Tags

  1. Navigate to your annotation Project.
  2. Navigate to the Settings tab.
  3. Click the dropdown in the Issue tags section.
  4. Select, or type the name of, the issue tag you want to add to the Project.
STEP 3: [Annotator / Reviewer] Create Issues

For more information, refer to the Issues documentation.
Issues cannot be created in a Consensus annotate stage.

Tile Selection for Data Groups

For Data Groups with multiple tiles, the Issues panel includes a tile selector that allows you to:
  • View issues specific to each tile
  • Create issues that apply to a particular tile
  • See validation warnings for missing required annotations across all tiles
The tile selector displays a badge showing the number of issues for each tile, helping you quickly identify which tiles need attention.
  1. Open a review task from the Queue tab of your annotation Project.
  2. Reject a label. The Issues pane opens.
  3. Select any Issue Tags you want to apply to the issue.
  4. Add a comment explaining why the label is being rejected.
  5. Click Reject to create the label rejection Issue.
  1. Click Reject task to reject the task.
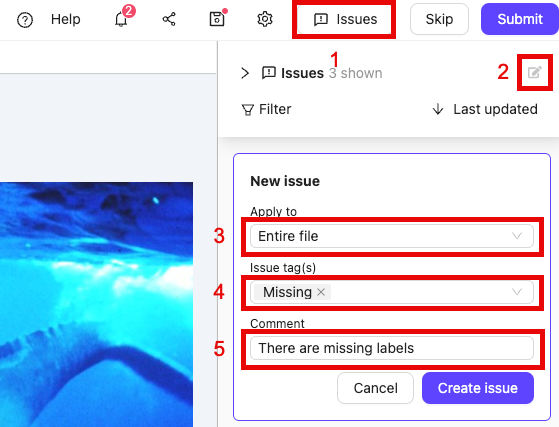
  1. Open a task from the Queue tab of your annotation Project.
  2. Open the Issues pane by clicking the Issues icon.
  3. For data groups with multiple tiles, select the specific tile the issue applies to using the tile selector dropdown.
  4. Click the New issue icon (or keyboard shortcut Ctrl+N).
  5. Click the Apply to dropdown to select the type of issue you want to create.
  6. Select any Issue Tags you want to apply to the issue.
  7. Add a comment to the issue.
  8. If you selected ‘Pin on canvas’ in Step 5, click the desired location on the canvas.
  9. Click Create issue.

Multi-Tile Validation

For Data Groups with multiple tiles, Encord validates that required annotations are present on each individual tile, not just at the Data Group level.
When working with Data Groups containing multiple tiles, the Issues panel provides enhanced validation:
  • Per-tile validation: Required classifications and attributes are checked on each tile separately
  • Visual indicators: The Issues panel shows which tiles have missing required annotations
  • Tile-specific issues: Missing annotation issues are created for the specific tile where they’re absent
This ensures comprehensive annotation coverage across all tiles in a data group, maintaining annotation quality and completeness.

STEP 4: [Annotator / Reviewer] Resolve Issues

More information can be found in the Issues documentation.

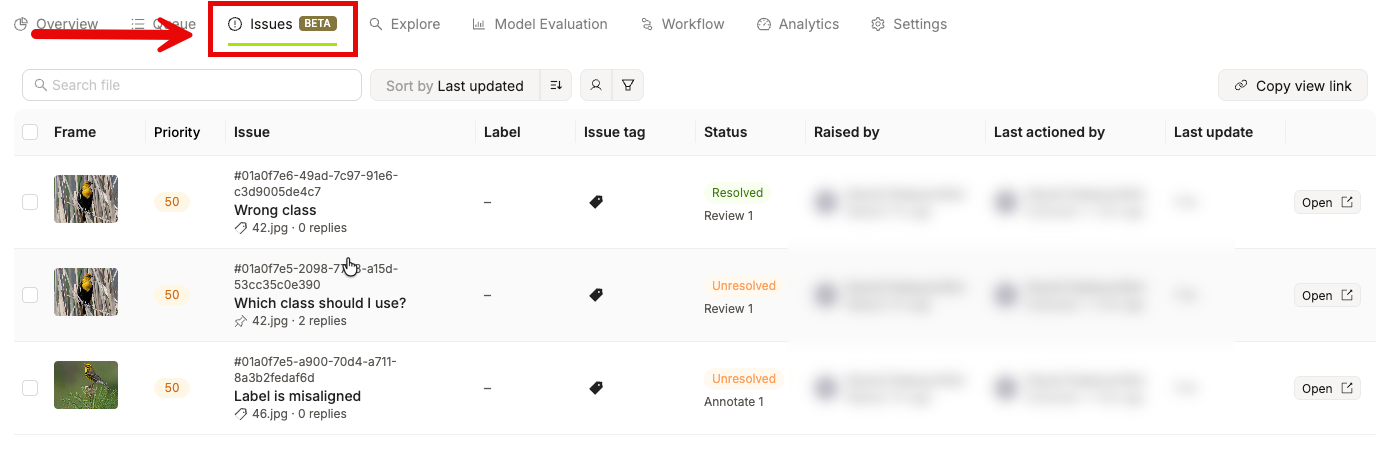
Filter Issues

You can filter issues in the Issues pane to focus on specific types or categories:
  1. Open the Issues pane by clicking the Issues icon.
  2. Click the Filter button to access filtering options.
  3. Use the available filters:
    • Resolution status: Filter by resolved, unresolved, or all issues
    • Issue types: Filter by specific issue types (data unit, frame, annotation, etc.)
    • Including issue tags: Show only issues that carry the selected tags. Selecting one or more tags here limits the list to issues with those tags.
    • Excluding issue tags: Hide issues that carry the selected tags. Selecting one or more tags here removes matching issues from the list.
    • Object class: Filter by specific object or classification classes from your Ontology
    • Comment keyword: Search for specific text within issue comments
  4. Select your desired filter criteria. The issues list updates automatically to show only matching issues.
The Including issue tags and Excluding issue tags filters only appear when your Project has issue tags configured. Both filters compose: an issue must match the include condition and not match any exclude condition to appear in the list. A tag selected in one section is automatically removed from the options in the other section, so the same tag cannot be both included and excluded simultaneously. Clearing all filters resets both tag filter sections.
  1. To clear all filters, click Clear filters or use the Clear filters button that appears when no issues match your current filter.
The object class filter shows all object and classification classes from your Project’s Ontology. If no issues match your current filter, you’ll see a message with an option to clear all filters.

Resolve Issues

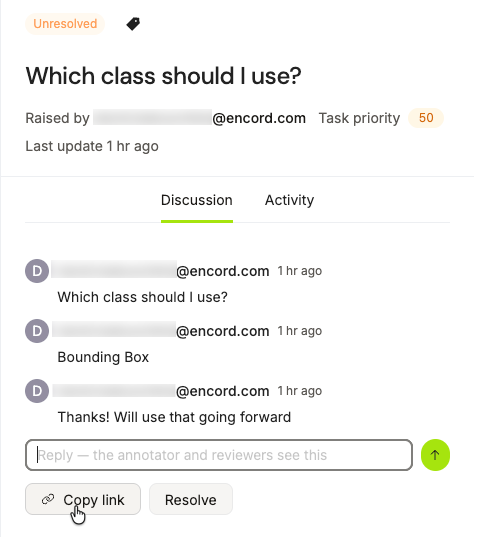
  1. Open a task from the Queue tab of your annotation Project. Rejected tasks The Label Editor with the Issues pane already opened appears.
  2. Address the problem raised by the Issue.
  3. Add a reply to the Issue acknowledging the issue has been addressed.
  4. Resolve the Issue by clicking the tick icon on the thread.

STEP 5: [Project Admin / Team Manager] Issue Analytics

The number of issue actions taken by each Project collaborator can be viewed in the Collaborators tab.
  1. Navigate to the Analytics tab of your Project.
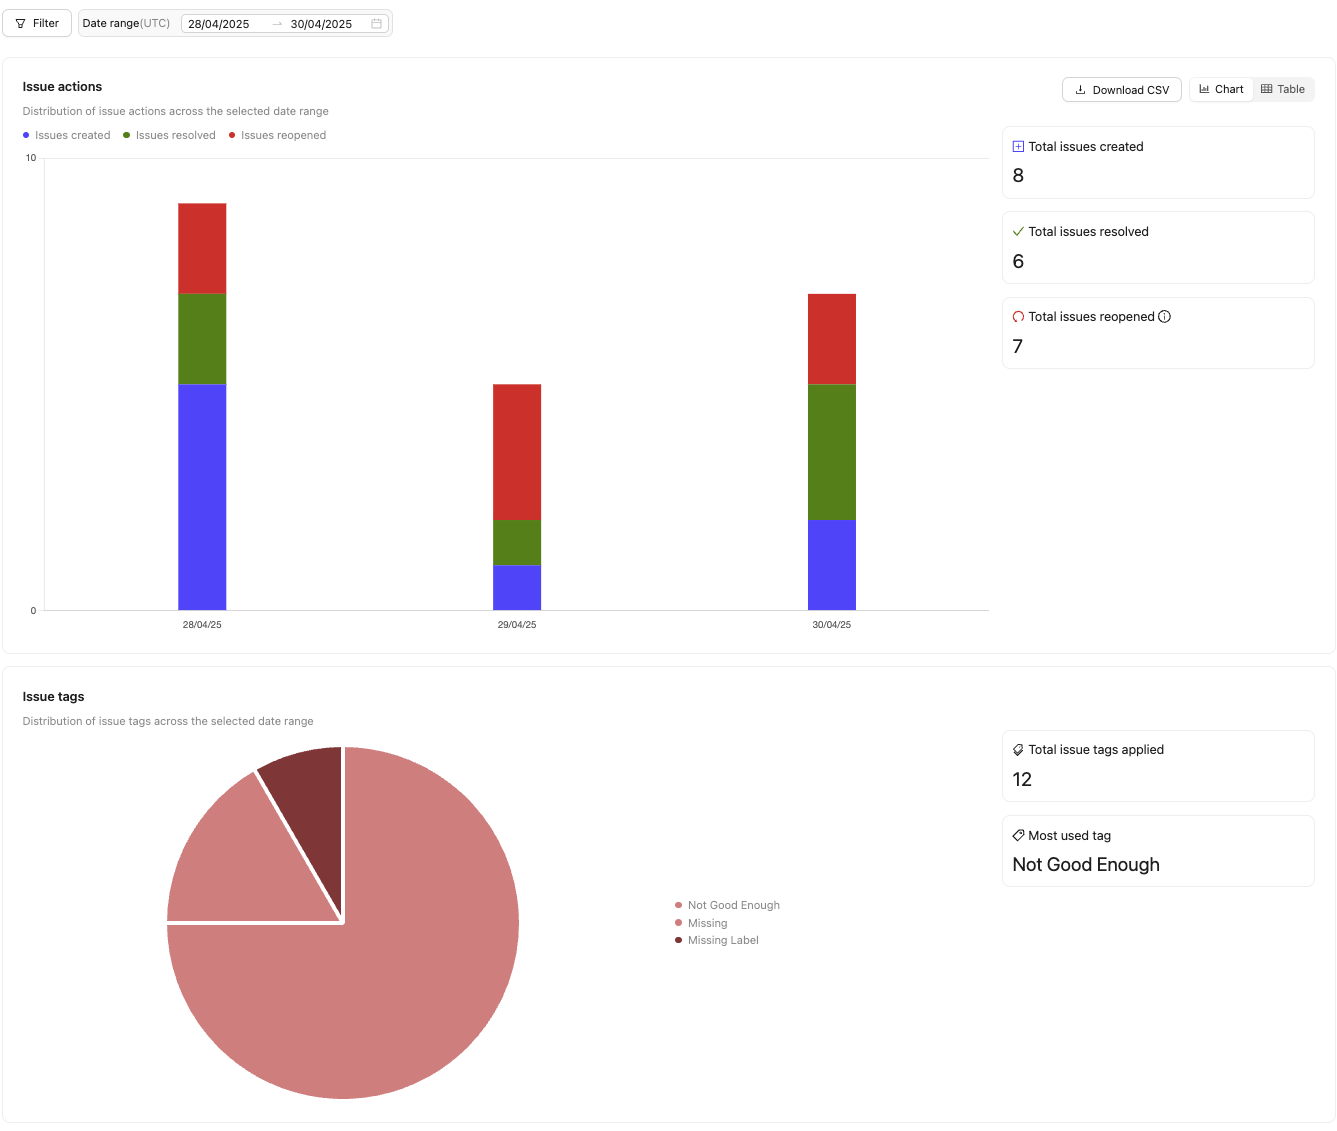
  2. Navigate to the Issues section. Analytics pertaining to Issues appear.
Overview

Project Overview Summary Cards

The Overview tab of your Project displays a set of summary cards that give you an at-a-glance view of Project health. These cards are hidden for labeling-services-only Projects. Top row — stat cards A row of three compact stat cards appears above the task-status chart: Task status chart The task status bar chart displays the number of tasks at each stage of your Workflow. When no task data is available, the chart displays an empty state illustration with the message “Configure data to see tasks status” instead of a blank chart. Tooltips are also disabled in this state. Bottom row — distribution cards Below the task-status chart, two cards appear side by side:
  • Class Distribution — shows the top 5 and bottom 5 Ontology classes by label instance count. The subtitle displays the total number of label instances. Click Show analytics to open the Labels analytics tab. When no label instances exist yet, the card displays “Instance labels by class will appear here.”
  • Top Issue Tags — shows up to 10 issue tags ranked by frequency, with amber-colored horizontal bars. The subtitle displays the total number of issue tags created. Click Show analytics to open the Issues analytics tab. When no issue tags are configured or used, the card displays an empty state with a Setup issue tags link to your issue-tag settings.
The tag counts on the Top Issue Tags card reflect tag-action totals (including re-rejections), not unique issue counts. The No tag bucket — representing issues with no tag applied — is an approximation and may show 0 even when untagged issues exist. An accurate untagged count requires a future backend update.

Workflow Mini-Map

Annotation, review, and other queue-type stage nodes in the mini-map are clickable. Clicking a stage node navigates you directly to the Queue tab, pre-filtered to that stage.
A pointer cursor appears when you hover over a clickable stage node, indicating that you can click it to jump to the corresponding queue.
The following node types are not clickable and do not navigate to the Queue:
  • Start
  • Percentage Router
  • User Router

Analytics

The Analytics tab of your Project shows event-based analytics for your Project’s tasks, labels, and users. The Analytics tab has the following views:
  • Tasks: View analytics on specific tasks in your Project.
  • Labels: View analytics of labels in your Project.
  • Collaborators: View collaborator performance in your Project.
  • Issues: View analytics relating to issues in your Project.
  • Agents: View analytics relating to Agent stages in your Project.
The Class Distribution and Top Issue Tags cards on the Project Overview provide quick access to the Labels and Issues sub-tabs of the Analytics section. Click Show analytics on either card to navigate directly to the corresponding detailed view.
The analytics available on the Analytics dashboard vary based on user roles:
  • Admins and Team Managers have access to the Tasks, Labels, and Collaborators views, offering a comprehensive overview of team performance.
  • Annotators, Reviewers, and Annotator + Reviewer roles can only view the Task Actions, Time Spent, and Label Actions tables, limited to their individual contributions.
Actions performed in the Label Editor or using the SDK are only tracked on the Analytics dashboard if they the tasks are actioned (submitted/rejected/approved).
Project Analytics have the following filters: Top row — stat cards A row of three compact stat cards appears above the task-status chart: Bottom row — distribution cards Below the task-status chart, two cards appear side by side:
  • Class Distribution — shows the top 5 and bottom 5 Ontology classes by label instance count. The subtitle displays the total number of label instances. Click Show analytics to open the Labels analytics tab. When no label instances exist yet, the card displays “Instance labels by class will appear here.”
  • Top Issue Tags — shows up to 10 issue tags ranked by frequency, with amber-colored horizontal bars. The subtitle displays the total number of issue tags created. Click Show analytics to open the Issues analytics tab. When no issue tags are configured or used, the card displays an empty state with a Setup issue tags link to your issue-tag settings.
The tag counts on the Top Issue Tags card reflect tag-action totals (including re-rejections), not unique issue counts. The No tag bucket — representing issues with no tag applied — is an approximation and may show 0 even when untagged issues exist. An accurate untagged count requires a future backend update.

Tasks

The Tasks tab of the Analytics dashboard provides a detailed overview of task throughput, stage efficiency, and task timers. It can help answer questions such as:
  1. How productive was each collaborator in terms of labeling and reviewing tasks over the last week?
    • By filtering the data by Collaborators and Date time range, you can see how many tasks each team member worked on and how much time they spent on labeling and reviewing.
  2. Which Dataset has the most labels added, edited, or deleted in a given Workflow stage?
    • You can filter by Datasets and Workflow stage to see which Dataset is being worked on the most and how many labels are being modified at each stage of the process.
The following charts are visible in the Tasks view: The Task performance table includes the following columns:
  • File name: The name of the file associated with the task.
  • Data type: The type of file used in the task (example: image, video, DICOM).
  • Dataset: The Dataset from which the task originates.
  • Total time: The total time spent on the task.
  • Total created labels: The number of labels created in the task.
  • Total edited labels: The number of labels that were modified in the task.
  • Total deleted labels: The number of labels that were removed in the task.
  • Time spent - The amount of time spent in a specific Workflow stage.
  • Collaborators - The users who contributed to a specific Workflow stage.
  • Created labels - The number of labels created in a specific Workflow stage.
  • Edited labels - The number of labels modified in a specific Workflow stage. In review stages, this refers to Edit Review.
  • Deleted labels - The number of labels removed in a specific Workflow stage.

Labels

Label analytics are not supported for Text and Audio modalities.
The Labels tab in the Analytics dashboard provides a detailed overview of your team’s labeling, reviewing, and task productivity, including time spent. It can help answer questions such as:
  1. How many labels were submitted, approved, or rejected by the team over a given period?
    • Use the Label actions chart and apply the Date time range filter to view the total number of labels submitted, approved, or rejected within the selected time frame.
  2. What actions have been taken for specific objects and classifications in the Ontology?
    • Refer to the Objects and classifications actions chart and expand classifications within the Ontology column to see detailed statistics for each classification answer.
  3. How does the team’s productivity in labeling compare across different objects or classifications? Do certain objects take more time to label than others?
    • Analyze the Created, Approved, and Rejected columns in the Objects and classifications actions table to identify objects or classifications that might require additional review or clarification using their Rejection rate.
    • Compare the average time spent per object or classification by utilizing time-tracking metrics alongside these productivity statistics.
All charts allow you to view instance labels or frame labels by selecting the appropriate option from the dropdown next to the filter button.
The Objects and classifications actions table includes the following columns:
  • Ontology: Represents the Ontology class, encompassing both objects and classifications. For classifications, you can expand to view statistics for each classification answer.
  • Created: Displays the total number of instances created for this Ontology class. Each instance is counted only once, ensuring that resubmissions of the same label are not double-counted.
  • Approved: Displays the total number of instances of this Ontology class that have been approved. Approvals are counted multiple times if a label is approved in multiple review stages or if the task is reopened and reviewed again. Use stage-specific filters to see approvals per review stage.
  • Rejected: Displays the number of instances of this Ontology class that have been rejected. Rejections are double-counted if a label is rejected in multiple review stages, rejected again within the same stage, or if the task is reopened and rejected again. Use stage-specific filters to see rejections per review stage.
  • Rejection Rate: Calculates the rejection rate percentage of the given Ontology class by dividing the number of rejected labels by the total number of reviewed labels.

Collaborators

The Collaborators in the Analytics dashboard provides a detailed view of time spent annotating and reviewing by Project collaborators. It can help answer questions such as:
  1. How much time did each collaborator spend on annotation / review tasks?
    • Use the Time spent chart to see the time distribution for each collaborator across annotation and review tasks. The Annotators and Reviewers tables, which provide total and average times for each collaborator.
  2. Which collaborator spent the most time annotating or reviewing tasks in the Project?
    • Analyze the Time spent chart to identify the collaborator with the highest time allocation.
  • Labels refer to objects and classifications.
  • Approve actions are double counted if there are multiple review stages.
  • Review actions are double counted if multiple review stages are present or tasks get rejected again in the same review stage.
Both tables and all CSV exports are filter-sensitive; they only display information within the selected filter conditions.
The Annotators and Reviewers table columns vary depending on whether the Instance labels or Frame labels view is selected. They include the following columns.
The Annotators table includes the following columns:
  • Submitted tasks: Total tasks submitted by the annotator.
  • Skipped tasks: Total tasks skipped by the annotator.
  • Approved tasks: Tasks submitted by the annotator that were approved in subsequent review stages.
  • Rejected tasks: Tasks submitted by the annotator that were rejected during review.
  • Task rejection rate: Percentage of the annotator’s submitted tasks that were rejected. If multiple review stages are present, use workflow filters to view stage-specific rejections.
  • Created labels: Total new labels submitted by the annotator. Include any pre-labels imported using the SDK by admins.
  • Edited labels: Total existing labels edited by the annotator. This includes pre-labels from an Agent stage, or labels from a previous Annotate stage. Vertex / coordinate changes are not tracked.
  • Deleted labels: Total existing labels deleted by the annotator. This includes pre-labels from an Agent stage, or labels from a previous Annotate stage.
  • Approved labels: Labels submitted by the annotator that were approved during review.
  • Rejected labels: Labels submitted by the annotator that were rejected during review.
  • Label rejection rate: Percentage of the annotator’s submitted labels that were rejected during review.
  • Total annotation time: Total active time spent annotating in the Label Editor, rounded to the nearest second.
  • Avg time per task: Average time spent on each submitted annotation task. Calculated using the total active time spent in the Annotate stage divided by the number of submitted tasks.
  • Issue actions against user: The number of Issue actions taken against the user.
The Reviewers table includes the following columns:
  • Approved tasks: Number of tasks approved by the reviewer.
  • Rejected tasks: Number of tasks rejected by the reviewer.
  • Task rejection rate: Percentage of reviewed tasks that were rejected by the reviewer.
  • Created labels: Total labels created by the reviewer using Edit Review.
  • Edited labels: Total labels edited by the reviewer using Edit Review.
  • Deleted labels: Total labels deleted by the reviewer using Edit Review.
  • Approved labels: Number of labels approved by the reviewer.
  • Rejected labels: Number of labels rejected by the reviewer.
  • Total review time: Total active time spent reviewing in the Label Editor, rounded to the nearest second.
  • Avg time per label: Average time spent on each reviewed label. Calculated using the total active time spent in the Review stage divided by the number of reviewed labels.
  • Avg time per task: Average time spent on each actioned review task. Calculated using the total active time spent in the Review stage divided by the number of actioned reviews.
  • Issue actions by user: The number of Issue actions taken by the user.
The Annotators table includes the following columns:
  • Submitted tasks: Total tasks submitted by the annotator.
  • Skipped tasks: Total tasks skipped by the annotator.
  • Approved tasks: Tasks submitted by the annotator that were approved in subsequent review stages.
  • Rejected tasks: Tasks submitted by the annotator that were rejected during review.
  • Task rejection rate: Percentage of the annotator’s submitted tasks that were rejected. If multiple review stages are present, use workflow filters to view stage-specific rejections.
  • Created frame labels: Total new labels submitted by the annotator. Include any pre-labels imported using the SDK by admins.
  • Edited frame labels: Total existing labels edited by the annotator. This includes pre-labels from an Agent stage, or labels from a previous Annotate stage. Vertex / coordinate changes are not tracked.
  • Deleted frame labels: Total existing labels deleted by the annotator. This includes pre-labels from an Agent stage, or labels from a previous Annotate stage.
  • Approved frame labels: Labels submitted by the annotator that were approved during review.
  • Rejected frame labels: Labels submitted by the annotator that were rejected during review.
  • Frame label rejection rate: Percentage of the annotator’s submitted labels that were rejected during review.
  • Total annotation time: Total active time spent annotating in the Label Editor, rounded to the nearest second.
  • Avg time per task: Average time spent on each submitted annotation task. Calculated using the total active time spent in the Annotate stage divided by the number of submitted tasks.
The Reviewers table includes the following columns:
  • Approved tasks: Number of tasks approved by the reviewer.
  • Rejected tasks: Number of tasks rejected by the reviewer.
  • Task rejection rate: Percentage of reviewed tasks that were rejected by the reviewer.
  • Created frame labels: Total labels created by the reviewer using Edit Review.
  • Edited frame labels: Total labels edited by the reviewer using Edit Review.
  • Deleted labels: Total labels deleted by the reviewer using Edit Review.
  • Approved frame labels: Number of labels approved by the reviewer.
  • Rejected frame labels: Number of labels rejected by the reviewer.
  • Total review time: Total active time spent reviewing in the Label Editor, rounded to the nearest second.
  • Avg time per frame label: Average time spent on each reviewed label. Calculated using the total active time spent in the Review stage divided by the number of reviewed frame labels.
  • Avg time per task: Average time spent on each actioned review task. Calculated using the total active time spent in the Review stage divided by the number of actioned reviews.
You can choose which columns should be displayed and included in the CSV export using the Columns selector.

Issues

The Issues tab in the Analytics dashboard provides a detailed view of all issues created in the Project.
The Issue actions chart shows the following:
  • Total issues created: The total number of issues created.
  • Total issues resolved: The number of issues marked as resolved.
  • Total issues reopened: The number of issues that were reopened.
Example - How to Understand Issue Analytics: If your Issue actions chart shows:
  • Total issues created = 19
  • Total issues resolved = 20
  • Total issues reopened = 2
This means that:
  • 19 issues were created.
  • All 19 issues were resolved.
  • 2 resolved issues were reopened. (This includes manually reopening an issue and re-rejections of labels)
  • 1 of the reopened issues was resolved.
  • There is one remaining open issue.

Agents

The Agents tab in the Analytics dashboard provides a detailed view of all Agents run in the Project.
The Issue actions chart shows the following:
  • Total issues created: The total number of issues created.
  • Total issues resolved: The number of issues marked as resolved.
  • Total issues reopened: The number of issues that were reopened.
Example - How to Understand Issue Analytics: If your Issue actions chart shows:
  • Total issues created = 19
  • Total issues resolved = 20
  • Total issues reopened = 2
This means that:
  • 19 issues were created.
  • All 19 issues were resolved.
  • 2 resolved issues were reopened. (This includes manually reopening an issue and re-rejections of labels)
  • 1 of the reopened issues was resolved.
  • There is one remaining open issue.

Creating Issues With Agents

Issues can be created inside an Agent Workflow Stage. The following example shows how to list all issues, and create file-level, frame-level, and coordinate-level issues on tasks within an Agent stage.