

STEP 1: Apply Geospatial Custom Metadata
Before you do anything, you need to apply geospatial custom metadata to your data. To learn how to apply geospatial custom metadata:- Create a Metadata Schema
- Apply geospatial custom metadata on new data or existing data.
STEP 2: Filter Data
Use the following ways to filter geospatial custom metadata:- Custom metadata filter
- Map View
- Go to Data > Explore.
- Select the folder containing the files.
-
Perform one of the following:
- Filter the data units using a custom metadata field.
- Use the Map View to select/filter the data units.
The Map View opens as a right-hand panel alongside the always-visible grid. When you draw a shape on the map, Encord applies the geospatial filter, zooms the camera to the selected area, and discards the drawing. The filter pill in the toolbar is the only persistent artifact — dismiss it to clear the filter. The grid on the left updates immediately to show matching items.
Map View
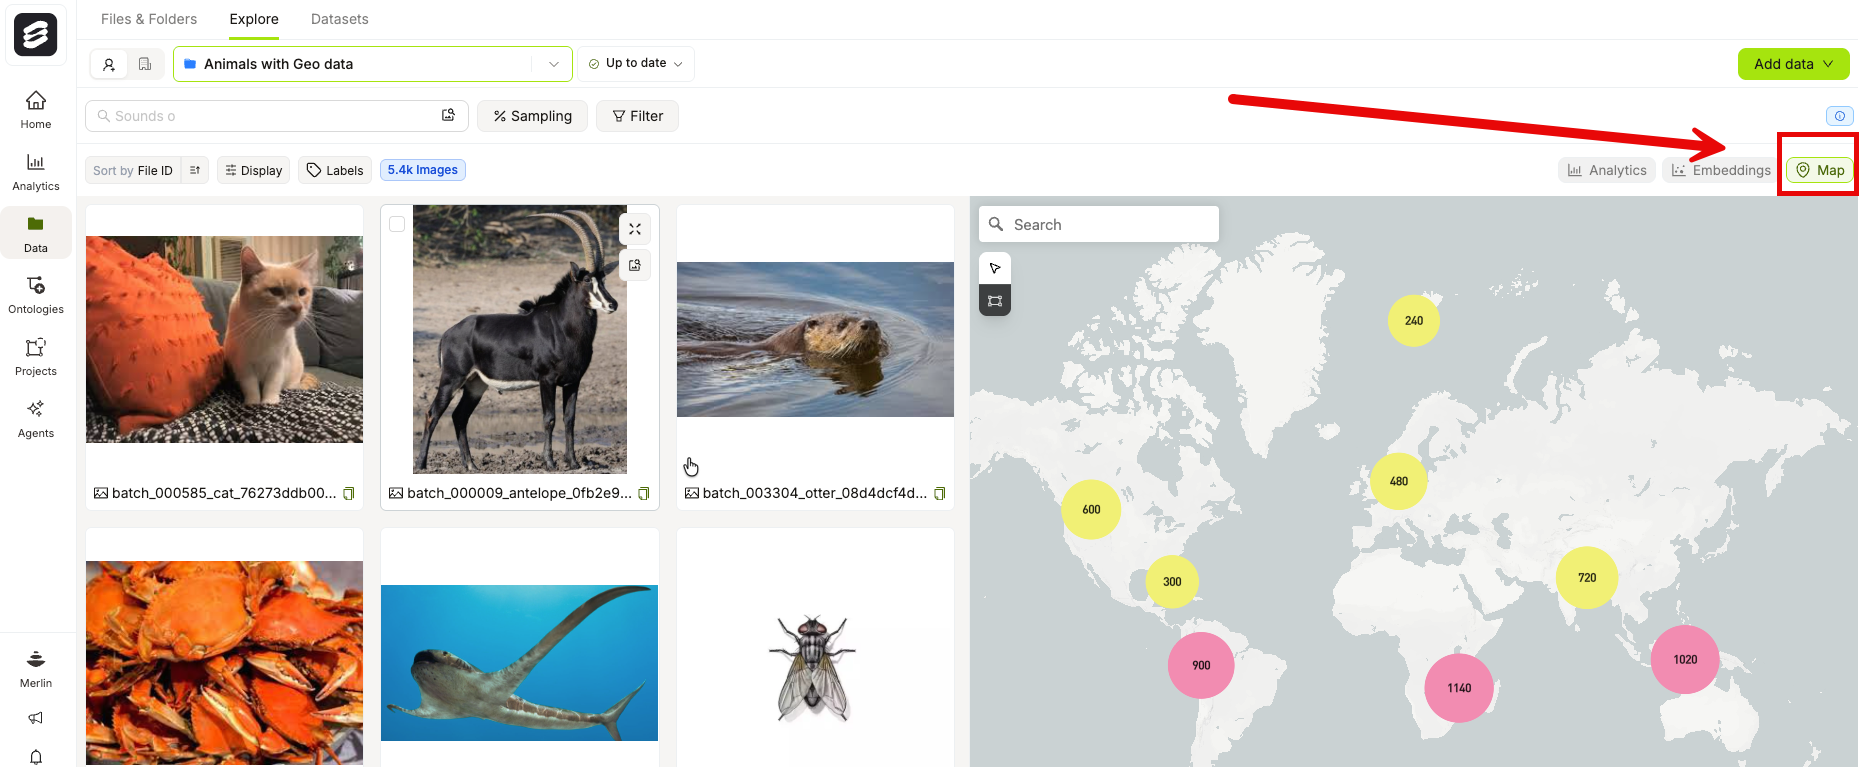
V then M, to open or close the Map panel. You can also deep-link directly to the Map panel by appending ?panel=map to the Explorer URL.
Map Style
The Map View includes a style picker in the bottom-right corner of the map. Use it to switch the map background between three styles:- Map — Standard vector map. Respects your dark or light mode setting.
- Satellite — Satellite imagery with street overlays, useful for real-world visual reference.
- Terrain — Topographic/outdoors style, useful for understanding elevation and landscape context.
The Map style is the only style that adapts to dark and light mode. Satellite and Terrain styles always display in their default appearance regardless of your mode setting.
Your style selection resets to Map each time you reload the page.
- Open the Map View in the Geospatial Explorer.
- Locate the Map / Satellite / Terrain pill control in the bottom-right corner of the map.
- Click the style you want to apply. The map background updates immediately and your position and any drawn selections are retained.
Geospatial Filters
1
Open the Map panel
Click the Map icon in the toolbar row or press
V then M.2
Draw a shape
Use the draw tool in the map toolbar to draw a rectangle over the area you want to filter. The map starts in cursor/select mode — switch to the draw tool before drawing.
3
Review the results
Encord applies the geospatial bounding-box filter, zooms the camera to the selected area, and discards the drawing. The grid on the left immediately narrows to show only matching items.
4
Clear the filter
Dismiss the filter pill in the toolbar to remove the geospatial filter and restore the full grid.
Selecting and Acting on Items
After the grid narrows to your filtered items, use the unified selection toolbar at the bottom of the grid to select items and add or remove them from collections. The per-view selection toolbar that previously appeared in the Map panel no longer exists — all selection actions happen in the grid.Map Interaction
The Map View provides two interaction modes, selectable from the toolbar that appears below the geocoder search box in the top-left corner of the map. The toolbar is only visible when a geospatial metadata key is configured for your Project.Keyboard shortcuts are disabled when a modal is open or when your cursor focus is in the geocoder search box.
Pan & Click Mode
Pan & Click Mode
Pan & Click mode
Pan & Click is the default mode when you open the Map View. In this mode, you can pan the map, zoom, and click individual data points or clusters. Use the keyboard shortcutC to switch to this mode.Box Select Mode
Box Select Mode
Box Select mode
Box Select mode lets you draw a rectangular selection directly on the map by clicking and dragging. Use the keyboard shortcutB to switch to this mode.In Box Select mode:- The cursor changes to a crosshair.
- Map panning is disabled while you drag.
- A blue bounding-box outline appears on the map as you drag and persists after you release to show the selected area.
- Hover thumbnails and point-click handlers are suppressed while a drag is in progress.
- Press
Escapeto clear the current selection.
Applying a box selection as a filter
After you complete a box selection, a Zoom into selection button (filter icon) appears at the corner of the selection box. Click it to promote the selection to a persistent geospatial filter and zoom the map to fit the selected area.Keyboard shortcuts
Cluster Click-to-Zoom
The Map View displays data points as clusters when many items occupy the same geographic region. Click clusters to progressively drill down into smaller areas until individual items become visible. Clicking a cluster applies a tight geospatial bounding-box filter around that cluster’s region and re-queries the server at finer granularity. You can repeat this process — clicking clusters to narrow the view — until the filtered region contains 1,000 or fewer items. When the filtered region contains 1,000 or fewer items, the map automatically switches from aggregated cluster markers to individual data point markers. Each individual point represents a single data item with its exact coordinates.The 1,000-item threshold is a fixed limit. It is not configurable.
Clicking individual points
Once the map switches to individual-item mode, click any single point marker to open the Item Preview Modal for that data item. The modal displays the item’s details directly from the map view.While the Item Preview Modal is open, the map viewport controls and style picker are hidden. They reappear when you close the modal.