

Supported Files
Time series data currently supports CSV files with a MIME type oftext/csv or application/csv.
Each file must contain a header row, one timestamp column, and at least one channel column. See Timestamp column for how Encord picks and interprets the timestamp column.
Example
Column Structure
Timestamp column
Encord does not validate time series CSVs on upload. The Label Editor validates and parses the file when you open it, so a CSV that uploads without errors can still display incorrectly. Check your file against the rules below before you upload it. Encord picks the timestamp column as follows:- The timestamp column is the first column whose header is
t,time, ortimestamp, or starts with one of these followed by_or-(for exampletime_msortimestamp-utc). Matching is case-insensitive. - If no header matches, Encord uses the first column as the timestamp column.
- Every other column is treated as a channel and plotted in the timeline. Channel headers must be unique.
- Empty,
NaN,null, or otherwise non-numeric channel values are treated as gaps. - Rows without a valid timestamp are skipped.
Timestamp units
Encord infers the timestamp unit from the suffix of the timestamp column header:
If the header has no recognized suffix, Encord looks at the values. Clock values such as
00:01:23.500 are read as elapsed time, and ISO 8601 date-times are read as ISO timestamps. Any other numeric values are treated as frame indices on the timeline.
Unit-based timestamps (nanoseconds through ISO) are measured relative to the first valid row of the CSV. The first row always lines up with the start of the timeline, whatever its absolute value. ISO timestamps are read with millisecond precision.
Align Time Series with Video
When a time series file shares a timeline with a video, for example in a Data Group, index the time series by video frame rather than by time:- Make the frame column the first column of the CSV and give it a header without a unit suffix, such as
frame. - Set each value to the video frame the sample belongs to, starting at
0for the first video frame.
1.5 sits halfway between frames 1 and 2, so data sampled faster than the video frame rate keeps its position.
To convert timestamps to frame indices, multiply the time in seconds since the start of the video by the video frame rate:
Frame-indexed time series for a 30 fps video
Common Issues
These assumptions are temporary. In a future release, you will be able to specify them at upload time.
Register Time Series Data
Register time series CSV files with thetime_series top-level key in your upload JSON.
Time series upload JSON
upload_time_series() in the SDK. See Time-series Data (SDK).
Annotating Time Series Data
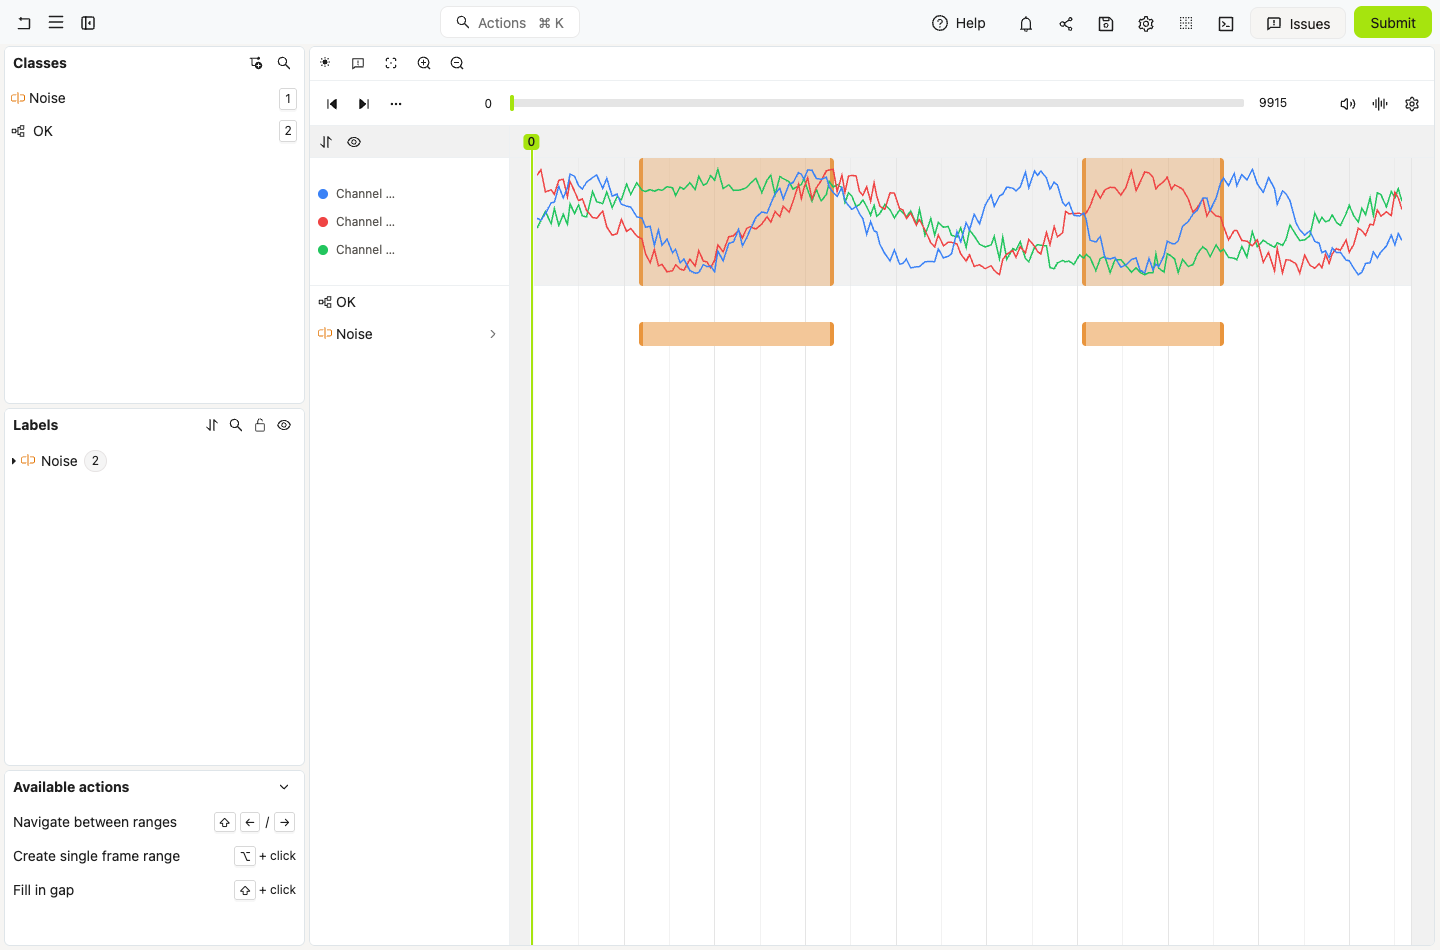
Open a time series task in the Label Editor. The timeline displays the channels above the annotation rows. Annotators can use the chart as context while creating and reviewing time range labels. For Composite Scenes, the timeline also displays each non-timestamp column from attached time series CSV streams. For MCAP Scenes with a configured layout, it displays the selected numeric time-series sub-channels. To label intervals on a time series file, add a Time range object to your Ontology. Time range labels appear on the timeline and can be used to mark events, anomalies, or segments of interest. The chart supports multiple channels. Channels are color-coded, and the timeline view can show time range labels below the chart. Time series uses the same timeline annotation interactions as other temporal modalities:- Select the Time range class.
- Create a range on the timeline for the event or segment you want to label.
- Adjust the range boundaries as needed.
- Submit the task when all required labels are complete.
Time Series in Data Groups
When a Data Group layout assigns a time series file to a tile, the Label Editor displays its channels in that tile instead of repeating them in the shared timeline. The chart stays synchronized with the group’s frame navigation and displays the current frame cursor. Scroll to pan the chart. To zoom, hold Ctrl (Windows) or Command (macOS) while scrolling, or pinch on a trackpad. You can also create and edit time range labels directly in the tile. Use Time series style settings in the tile toolbar to display each channel as a line or points and adjust its line width or point size. Encord assigns different default colors to channels across time series tiles so that you can distinguish them.Customize Time Series Channels
Use the channel controls in the timeline to adjust how each CSV channel appears in the chart.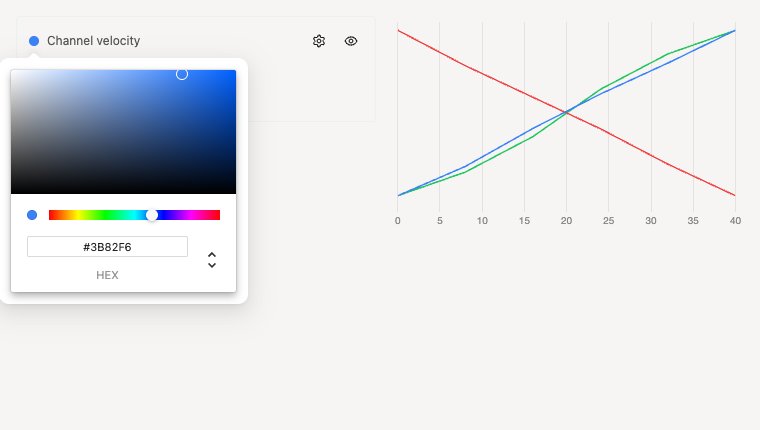
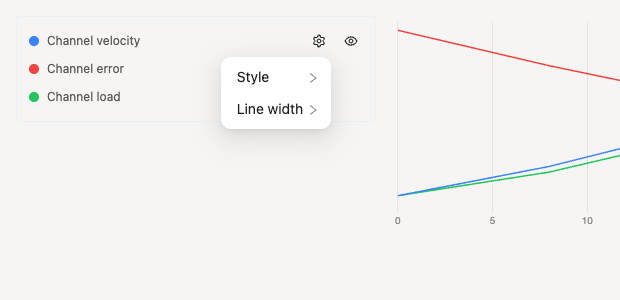
- Hide or show individual channels.
- Set a custom channel color.
- Change the channel style between line and points.
- Resize the channel by changing line width or point size.
You can also set channel appearance when you upload a time series file, or update it on existing files, using the SDK. See Time-series Data (SDK).