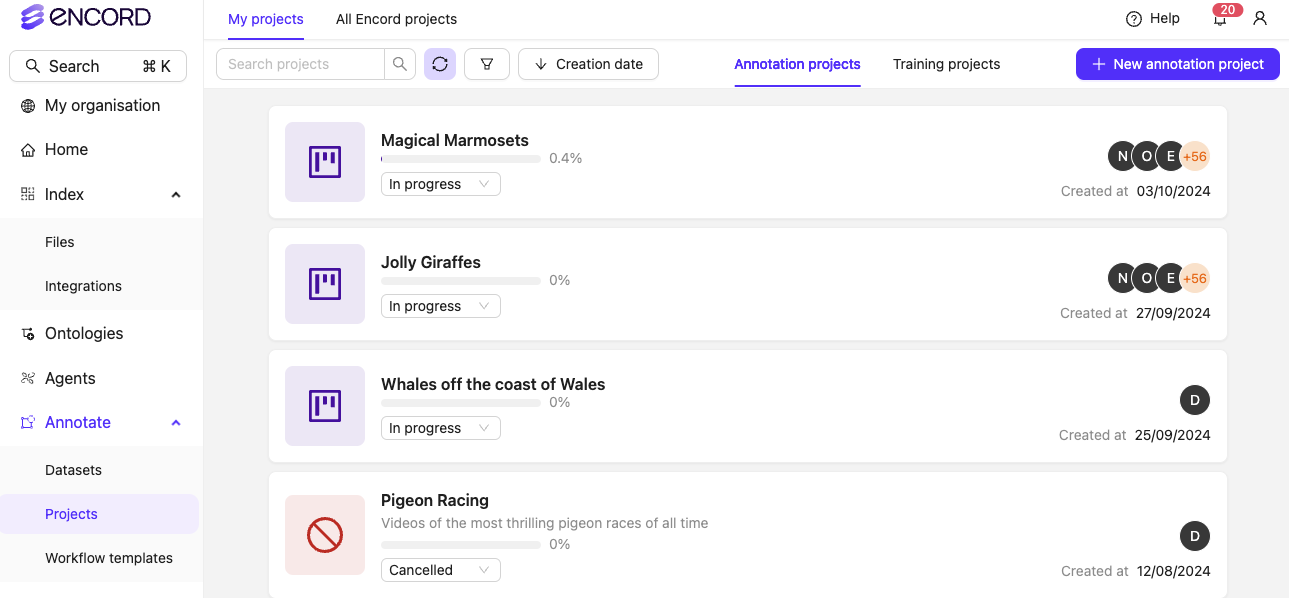
- In the Encord platform, navigate to Projects.
- Select the Project you want to Manage.
- Project Overview: High-level view of labeling and productivity statistics.
- Explore: Explore the distribution of instances and labels across data assets in the project.
- Queue: Shows all tasks in the Project by Workflow stage.
- Workflow: Graphically displays the path tasks follow through the Project Workflow.
- Analytics: Detailed Project analytics.
- Settings: Manage your Project Settings, including copying Projects, managing Project tags, customizing editor layouts, and deleting Projects.
Tab Visibility by Role
The Analytics and Queue tabs display different information based on the user’s role. For more details, refer to the Analytics dashboard documentation.
Update Project Status
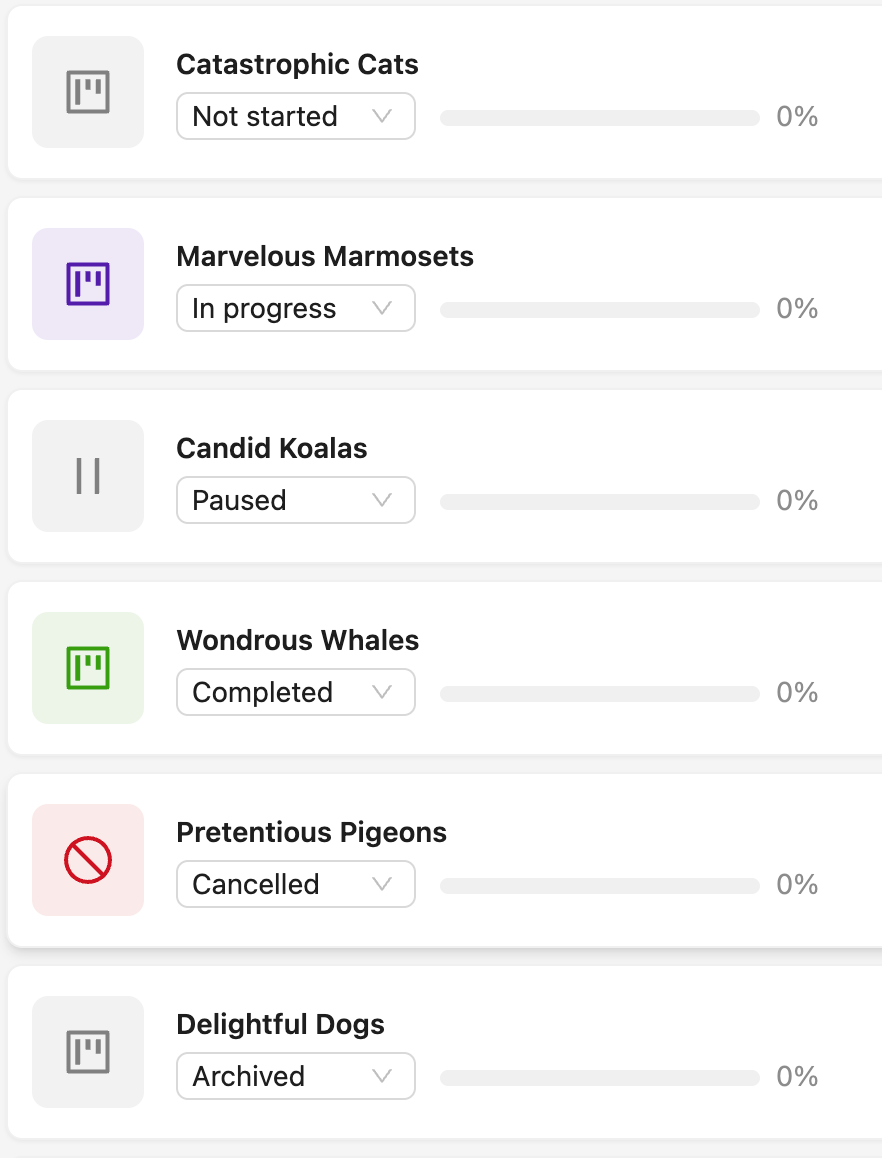
- Not started
- In progress
- Paused
- Completed
- Cancelled
- Archived
Updating the Project status changes the Project icon accordingly.
Tasks can still be opened using back door access. For example if an Admin shares a specific URL of a task with an Annotator, Reviewer, or Annotator + Reviewer.
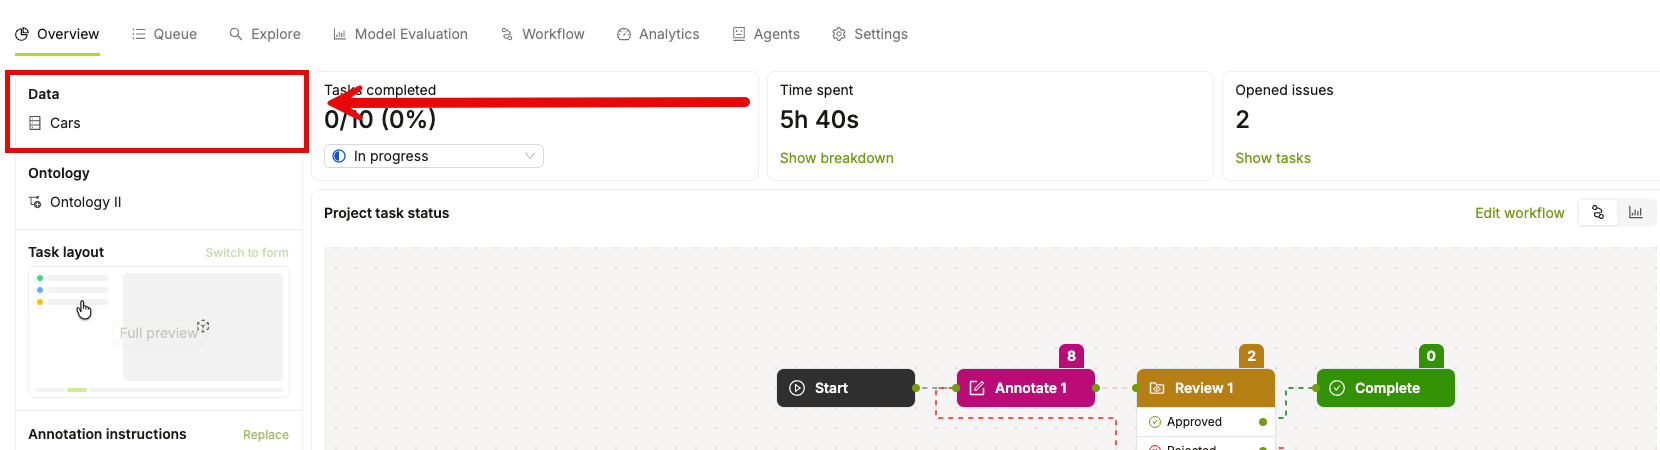
Project Overview
The Project Overview dashboard provides a high-level summary of your Project’s annotation health. It includes the Project task status chart and two analytics cards that surface class balance and issue tag patterns at a glance.The analytics cards (Class Distribution and Issue Tags) are not shown for labeling-services-only Projects.
| Component | Description |
|---|---|
| Project task status | Displays the number of tasks that are in each stage of your Project. The number of stages and their names reflect the choices made during workflow project selection/creation. |
| Class Distribution | Shows the top 3 and bottom 2 annotation classes by label instance count, with a relative bar chart and percentage for each class. Classes that represent less than 10% of all label instances are highlighted in amber to flag potential data imbalance. When more classes exist than the visible limit, a truncation indicator (for example, ”… 3 more classes”) appears. The card header displays the total number of label instances created. Click Open in Analytics → to navigate directly to the Labels sub-tab of the Analytics tab. Labels on Text and HTML files are not counted. |
| Issue Tags | Shows up to 5 of the most frequent issue tags with a relative bar chart and percentage for each tag. When more tags exist than the visible limit, a truncation indicator (for example, ”… 2 more tags”) appears. The card header displays the total number of open issues. Click Open in Analytics → to navigate directly to the Issues sub-tab of the Analytics tab. |
| Task layout | Displays the current task layout configuration for the Project. Shows Standard when the default layout is active, or Custom when a custom layout is configured. Click Set up to configure a custom layout, or hover over the card and click Edit to modify an existing custom layout. Click Preview to open an inline label editor preview in the right panel. Click Close preview to return to the analytics view. The Preview button is disabled when the Project has no demo data and no linked datasets — hover over it to see the tooltip “Link data to this project to see a preview”. |
Overview Cards
The Project Overview page displays the following cards alongside the summary statistics. Each card shows relevant configuration details and provides quick-access action buttons that appear when you hover over the card.The Edit button on the Project tags card is only visible to users with tag-edit permissions. If your Project was created before you joined a workspace, you cannot use Project tags — create a new Project to enable this feature.
Manage Project Data
- Left panel — Lists all available datasets and storage folders with search and infinite scroll. Use the Datasets and Folders tabs to switch between source types.
- Center panel — Displays a thumbnail grid preview of the selected dataset or folder’s files. Use this panel to add or remove the selected source and configure folder-specific options.
- Right panel — Shows the Project’s current data: the default dataset section and any additional datasets or folders, each with data-unit counts and status badges.
The exact button or menu that opens the Project Data Management modal may vary. Look for a Manage button on the Data card in the Project Overview, or check your Project settings.
Add a Dataset
1
Open the modal
Open the Project Data Management modal from within your Project.
2
Select a dataset
In the left panel, click the Datasets tab and select the dataset you want to add.The center panel displays a thumbnail grid preview of the dataset’s files.
3
Add the dataset
Click Add to project in the center panel.
4
Save your changes
Click Save in the modal footer to apply the changes.
Live datasets (datasets backed by a storage folder) display a LIVE indicator in the Project data panel. New files added to the backing folder automatically appear in the Project.
Remove a Dataset
1
Open the modal
Open the Project Data Management modal from within your Project.
2
Open Datasets tab
In the left panel, click the Datasets tab .
3
Select the dataset
In the left panel, click the Datasets tab and select the dataset you want to remove.
4
Remove the dataset
Click Remove from project in the center panel, then confirm the removal in the dialog that appears.
5
Save your changes
Click Save in the modal footer to apply the changes.
Add a Folder
1
Open the modal
Open the Project Data Management modal from within your Project.
2
Select a folder
In the left panel, click the Folders tab and select the folder you want to add.The center panel displays the folder’s contents with options to select files and configure settings.
3
Select files
Choose which files to include. Select all files or toggle individual files as needed.
4
Configure Continuous Data Flow (optional)
Toggle Continuous data flow to control whether future files added to the folder automatically enter the Project.When Continuous data flow is on and you have active filters, new files pass through those filters before entering the Project.
The Continuous data flow toggle is disabled when you select only a subset of items. Select all items to enable it.
5
Add the folder
Click Add to project.
6
Save your changes
Click Update project data in the modal footer to apply the changes.
Update a Folder Configuration
After you add a folder to a Project, you can update its file selection, filters, or Continuous Data Flow setting.1
Open the modal
Open the Project Data Management modal from within your Project.
2
Select the folder
In the left panel, click the Folders tab and select the folder you want to update.
3
Make your changes
Adjust the file selection, filters, or Continuous data flow toggle as needed.
4
Save the folder configuration
Click Update in the center panel to save the folder configuration.
5
Save your changes
Click Update project data in the modal footer to apply the changes to the Project.
Explore tab
The Explore tab is only visible to project Admins and Team Managers.
- Instance statistics: Class distribution across data assets in the given project.
- Label statistics: Label distributions within data assets, objects and classifications.
 Instance statistics
This section provides the total count of all instances across the datasets in your project.
Instance statistics
This section provides the total count of all instances across the datasets in your project.
- Project total: Shows total instances (both objects and classifications) across the project by default. To get instance statistics for individual data files, click the drop-down to select a data file.
- Select class: Shows the total instances for a particular class. This is a summary of how a given class is distributed across your project’s data assets. The pie chart segments show a breakdown of how that class is split across the data assets.
- Display timestamps: Flip the toggle to switch between frame numbers and timestamps for the labels.
- Project total: Shows the total number of labels across different datasets in the project. To get label stats for individual data files, click the drop-down to select a data file.
- Objects: Click on the pie chart segment of a class to see the total number of labels and its attributes (sometimes called nested attributes) if available for that class.
- Classifications: Shows the global classification at project or individual video level. For example, location, time of day, etc.
Task Queue & Workflow
Use the Queue tab to assign, prioritize, and manage tasks, and to start labeling and reviewing work. The Queue tab’s layout adapts based on your role (Admin, Team Manager, Annotator, Reviewer, or Annotator + Reviewer). Workflow tab:The Workflow tab is only visible to project Admins and Team Managers.
Save Label Version
- Click Export while in a Project.
Only Project admins can export labels
- Click Export while in a Project. The Export labels dialog appears.
-
Specify the following:
- Format: Specify the format to export the labels (JSON or COCO).
- Stage: Specify the Workflow stage to export the labels from.
- Generate signed URLs: Specify whether to generate signed URLs for the data units that have labels.
Enabling this option can significantly increase export times.- Save as new version: Specify to version the labels.
- Provide a meaningful name for the label version.
- Labels to include: Specify the labels to include. You can export all labels or select specific object or classification labels to export.
- Click Export. A Labels export in progress toast message appears.
- Go to Labels & Export > Versions. The version of your labels appears in the Versions table.
Analytics
Overview
Project Overview Summary Cards
The Overview tab of your Project displays a set of summary cards that give you an at-a-glance view of Project health. These cards are hidden for labeling-services-only Projects. Top row — stat cards A row of three compact stat cards appears above the task-status chart:
Task status chart
The task status bar chart displays the number of tasks at each stage of your Workflow. When no task data is available, the chart displays an empty state illustration with the message “Configure data to see tasks status” instead of a blank chart. Tooltips are also disabled in this state.
Bottom row — distribution cards
Below the task-status chart, two cards appear side by side:
- Class Distribution — shows the top 5 and bottom 5 Ontology classes by label instance count. The subtitle displays the total number of label instances. Click Show analytics to open the Labels analytics tab. When no label instances exist yet, the card displays “Instance labels by class will appear here.”
- Top Issue Tags — shows up to 10 issue tags ranked by frequency, with amber-colored horizontal bars. The subtitle displays the total number of issue tags created. Click Show analytics to open the Issues analytics tab. When no issue tags are configured or used, the card displays an empty state with a Setup issue tags link to your issue-tag settings.
The tag counts on the Top Issue Tags card reflect tag-action totals (including re-rejections), not unique issue counts. The No tag bucket — representing issues with no tag applied — is an approximation and may show 0 even when untagged issues exist. An accurate untagged count requires a future backend update.
Workflow Mini-Map
Annotation, review, and other queue-type stage nodes in the mini-map are clickable. Clicking a stage node navigates you directly to the Queue tab, pre-filtered to that stage. The following node types are not clickable and do not navigate to the Queue:- Start
- Percentage Router
- User Router
Analytics
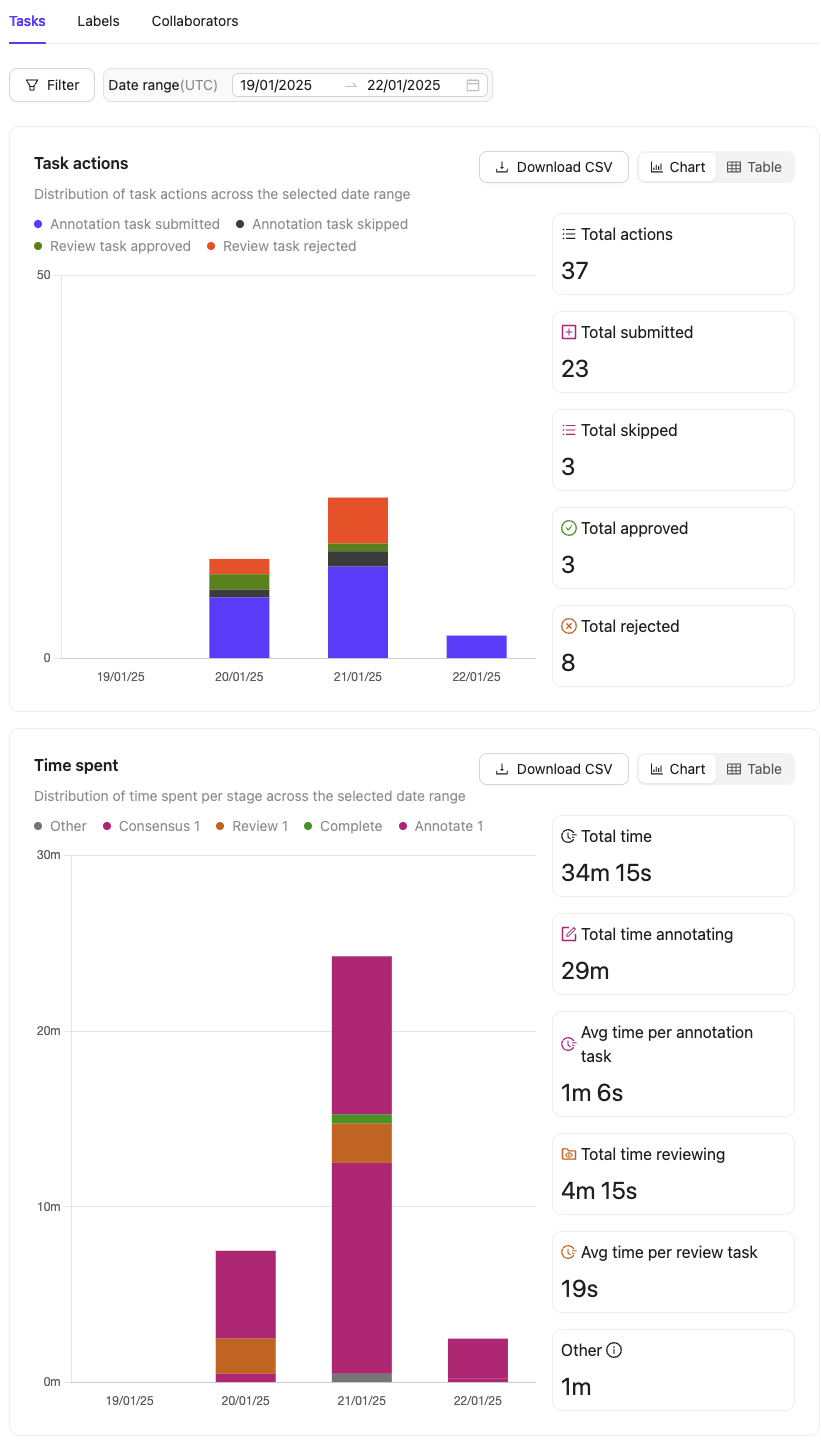
The Analytics tab of your Project shows event-based analytics for your Project’s tasks, labels, and users. The Analytics tab has the following views:- Tasks: View analytics on specific tasks in your Project.
- Labels: View analytics of labels in your Project.
- Collaborators: View collaborator performance in your Project.
- Issues: View analytics relating to issues in your Project.
- Agents: View analytics relating to Agent stages in your Project.
The analytics available on the Analytics dashboard vary based on user roles:
- Admins and Team Managers have access to the Tasks, Labels, and Collaborators views, offering a comprehensive overview of team performance.
- Annotators, Reviewers, and Annotator + Reviewer roles can only view the Task Actions, Time Spent, and Label Actions tables, limited to their individual contributions.
Top row — stat cards
A row of three compact stat cards appears above the task-status chart:
Bottom row — distribution cards
Below the task-status chart, two cards appear side by side:
- Class Distribution — shows the top 5 and bottom 5 Ontology classes by label instance count. The subtitle displays the total number of label instances. Click Show analytics to open the Labels analytics tab. When no label instances exist yet, the card displays “Instance labels by class will appear here.”
- Top Issue Tags — shows up to 10 issue tags ranked by frequency, with amber-colored horizontal bars. The subtitle displays the total number of issue tags created. Click Show analytics to open the Issues analytics tab. When no issue tags are configured or used, the card displays an empty state with a Setup issue tags link to your issue-tag settings.
The tag counts on the Top Issue Tags card reflect tag-action totals (including re-rejections), not unique issue counts. The No tag bucket — representing issues with no tag applied — is an approximation and may show 0 even when untagged issues exist. An accurate untagged count requires a future backend update.
Tasks
-
How productive was each collaborator in terms of labeling and reviewing tasks over the last week?
- By filtering the data by Collaborators and Date time range, you can see how many tasks each team member worked on and how much time they spent on labeling and reviewing.
-
Which Dataset has the most labels added, edited, or deleted in a given Workflow stage?
- You can filter by Datasets and Workflow stage to see which Dataset is being worked on the most and how many labels are being modified at each stage of the process.
The Task performance table includes the following columns:
- File name: The name of the file associated with the task.
- Data type: The type of file used in the task (example: image, video, DICOM).
- Dataset: The Dataset from which the task originates.
- Total time: The total time spent on the task.
- Total created labels: The number of labels created in the task.
- Total edited labels: The number of labels that were modified in the task.
- Total deleted labels: The number of labels that were removed in the task.
- Time spent - The amount of time spent in a specific Workflow stage.
- Collaborators - The users who contributed to a specific Workflow stage.
- Created labels - The number of labels created in a specific Workflow stage.
- Edited labels - The number of labels modified in a specific Workflow stage. In review stages, this refers to Edit Review.
- Deleted labels - The number of labels removed in a specific Workflow stage.
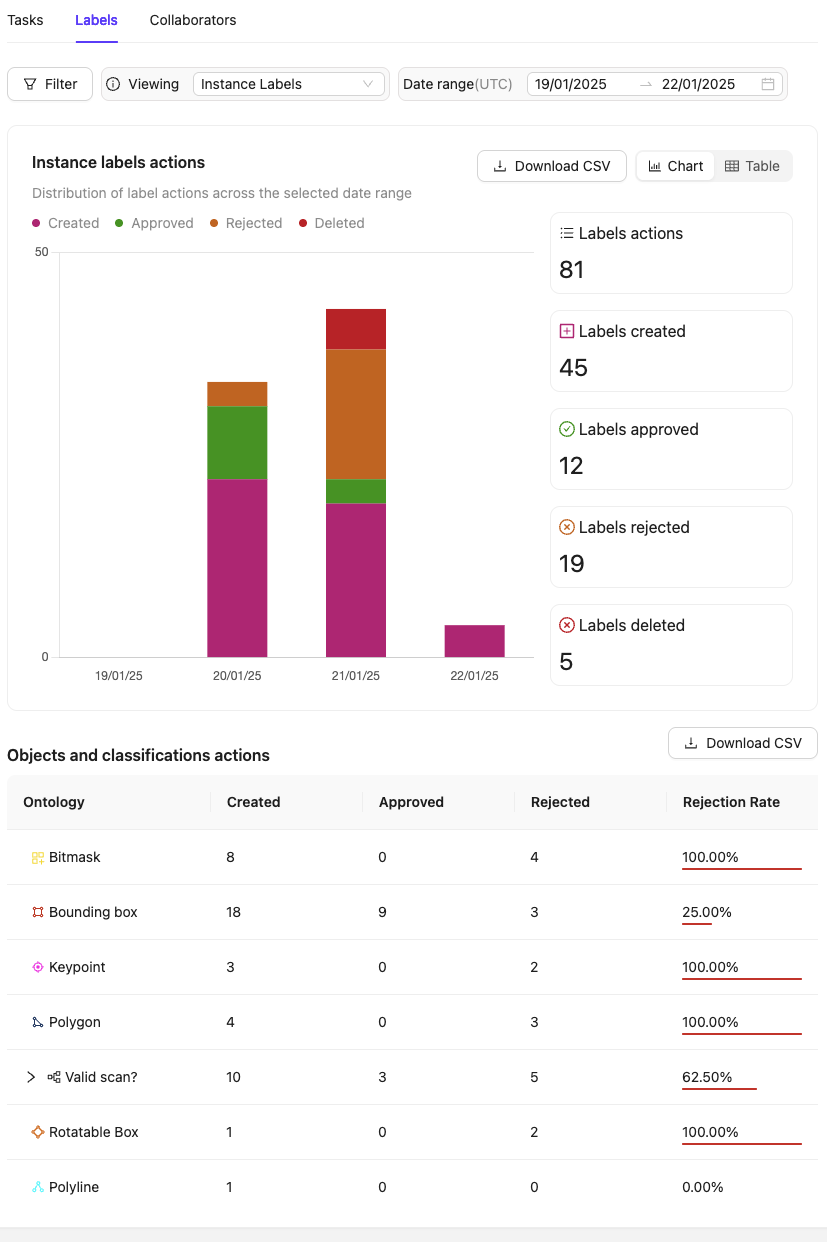
Labels
-
How many labels were submitted, approved, or rejected by the team over a given period?
- Use the Label actions chart and apply the Date time range filter to view the total number of labels submitted, approved, or rejected within the selected time frame.
-
What actions have been taken for specific objects and classifications in the Ontology?
- Refer to the Objects and classifications actions chart and expand classifications within the Ontology column to see detailed statistics for each classification answer.
-
How does the team’s productivity in labeling compare across different objects or classifications? Do certain objects take more time to label than others?
- Analyze the Created, Approved, and Rejected columns in the Objects and classifications actions table to identify objects or classifications that might require additional review or clarification using their Rejection rate.
- Compare the average time spent per object or classification by utilizing time-tracking metrics alongside these productivity statistics.
The Objects and classifications actions table includes the following columns:
- Ontology: Represents the Ontology class, encompassing both objects and classifications. For classifications, you can expand to view statistics for each classification answer.
- Created: Displays the total number of instances created for this Ontology class. Each instance is counted only once, ensuring that resubmissions of the same label are not double-counted.
- Approved: Displays the total number of instances of this Ontology class that have been approved. Approvals are counted multiple times if a label is approved in multiple review stages or if the task is reopened and reviewed again. Use stage-specific filters to see approvals per review stage.
- Rejected: Displays the number of instances of this Ontology class that have been rejected. Rejections are double-counted if a label is rejected in multiple review stages, rejected again within the same stage, or if the task is reopened and rejected again. Use stage-specific filters to see rejections per review stage.
- Rejection Rate: Calculates the rejection rate percentage of the given Ontology class by dividing the number of rejected labels by the total number of reviewed labels.
Collaborators
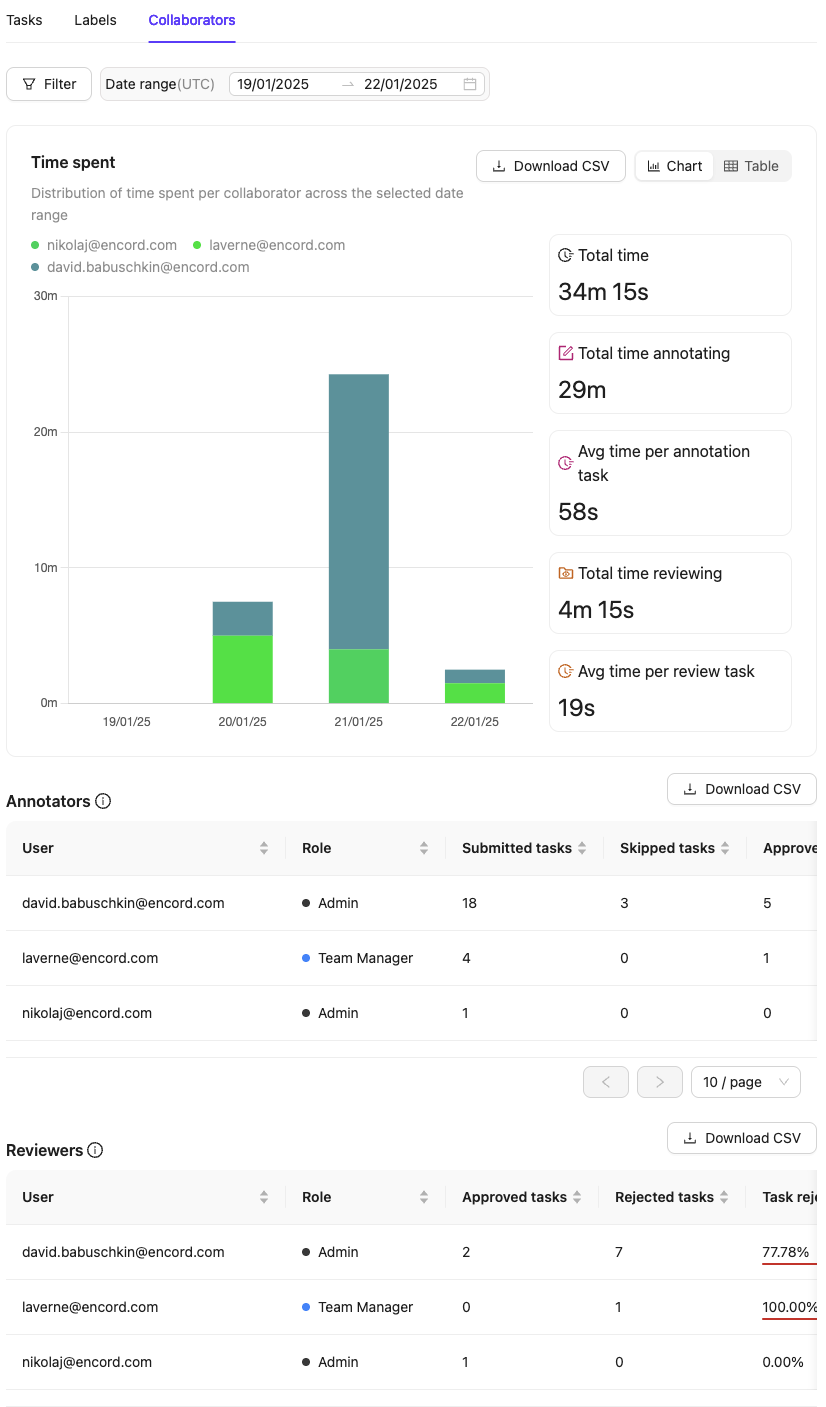
- How much time did each collaborator spend on annotation / review tasks?
- Use the Time spent chart to see the time distribution for each collaborator across annotation and review tasks. The Annotators and Reviewers tables, which provide total and average times for each collaborator.
- Which collaborator spent the most time annotating or reviewing tasks in the Project?
- Analyze the Time spent chart to identify the collaborator with the highest time allocation.
- Labels refer to objects and classifications.
- Approve actions are double counted if there are multiple review stages.
- Review actions are double counted if multiple review stages are present or tasks get rejected again in the same review stage.
Both tables and all CSV exports are filter-sensitive; they only display information within the selected filter conditions.
Instance Labels
Instance Labels
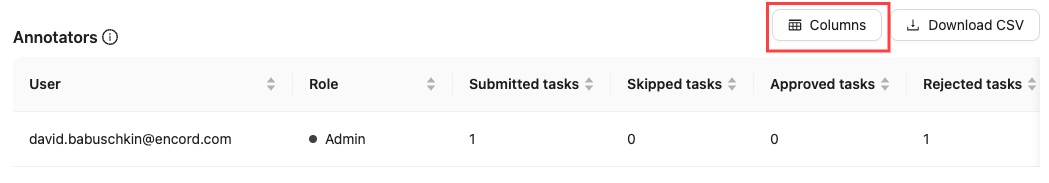
The Annotators table includes the following columns:
- Submitted tasks: Total tasks submitted by the annotator.
- Skipped tasks: Total tasks skipped by the annotator.
- Approved tasks: Tasks submitted by the annotator that were approved in subsequent review stages.
- Rejected tasks: Tasks submitted by the annotator that were rejected during review.
- Task rejection rate: Percentage of the annotator’s submitted tasks that were rejected. If multiple review stages are present, use workflow filters to view stage-specific rejections.
- Created labels: Total new labels submitted by the annotator. Include any pre-labels imported using the SDK by admins.
- Edited labels: Total existing labels edited by the annotator. This includes pre-labels from an Agent stage, or labels from a previous Annotate stage. Vertex / coordinate changes are not tracked.
- Deleted labels: Total existing labels deleted by the annotator. This includes pre-labels from an Agent stage, or labels from a previous Annotate stage.
- Approved labels: Labels submitted by the annotator that were approved during review.
- Rejected labels: Labels submitted by the annotator that were rejected during review.
- Label rejection rate: Percentage of the annotator’s submitted labels that were rejected during review.
- Total annotation time: Total active time spent annotating in the Label Editor, rounded to the nearest second.
- Avg time per task: Average time spent on each submitted annotation task. Calculated using the total active time spent in the Annotate stage divided by the number of submitted tasks.
- Issue actions against user: The number of Issue actions taken against the user.
- Approved tasks: Number of tasks approved by the reviewer.
- Rejected tasks: Number of tasks rejected by the reviewer.
- Task rejection rate: Percentage of reviewed tasks that were rejected by the reviewer.
- Created labels: Total labels created by the reviewer using Edit Review.
- Edited labels: Total labels edited by the reviewer using Edit Review.
- Deleted labels: Total labels deleted by the reviewer using Edit Review.
- Approved labels: Number of labels approved by the reviewer.
- Rejected labels: Number of labels rejected by the reviewer.
- Total review time: Total active time spent reviewing in the Label Editor, rounded to the nearest second.
- Avg time per label: Average time spent on each reviewed label. Calculated using the total active time spent in the Review stage divided by the number of reviewed labels.
- Avg time per task: Average time spent on each actioned review task. Calculated using the total active time spent in the Review stage divided by the number of actioned reviews.
- Issue actions by user: The number of Issue actions taken by the user.
Frame Labels
Frame Labels
The Annotators table includes the following columns:
- Submitted tasks: Total tasks submitted by the annotator.
- Skipped tasks: Total tasks skipped by the annotator.
- Approved tasks: Tasks submitted by the annotator that were approved in subsequent review stages.
- Rejected tasks: Tasks submitted by the annotator that were rejected during review.
- Task rejection rate: Percentage of the annotator’s submitted tasks that were rejected. If multiple review stages are present, use workflow filters to view stage-specific rejections.
- Created frame labels: Total new labels submitted by the annotator. Include any pre-labels imported using the SDK by admins.
- Edited frame labels: Total existing labels edited by the annotator. This includes pre-labels from an Agent stage, or labels from a previous Annotate stage. Vertex / coordinate changes are not tracked.
- Deleted frame labels: Total existing labels deleted by the annotator. This includes pre-labels from an Agent stage, or labels from a previous Annotate stage.
- Approved frame labels: Labels submitted by the annotator that were approved during review.
- Rejected frame labels: Labels submitted by the annotator that were rejected during review.
- Frame label rejection rate: Percentage of the annotator’s submitted labels that were rejected during review.
- Total annotation time: Total active time spent annotating in the Label Editor, rounded to the nearest second.
- Avg time per task: Average time spent on each submitted annotation task. Calculated using the total active time spent in the Annotate stage divided by the number of submitted tasks.
- Approved tasks: Number of tasks approved by the reviewer.
- Rejected tasks: Number of tasks rejected by the reviewer.
- Task rejection rate: Percentage of reviewed tasks that were rejected by the reviewer.
- Created frame labels: Total labels created by the reviewer using Edit Review.
- Edited frame labels: Total labels edited by the reviewer using Edit Review.
- Deleted labels: Total labels deleted by the reviewer using Edit Review.
- Approved frame labels: Number of labels approved by the reviewer.
- Rejected frame labels: Number of labels rejected by the reviewer.
- Total review time: Total active time spent reviewing in the Label Editor, rounded to the nearest second.
- Avg time per frame label: Average time spent on each reviewed label. Calculated using the total active time spent in the Review stage divided by the number of reviewed frame labels.
- Avg time per task: Average time spent on each actioned review task. Calculated using the total active time spent in the Review stage divided by the number of actioned reviews.
Issues
The Issues tab in the Analytics dashboard provides a detailed view of all issues created in the Project.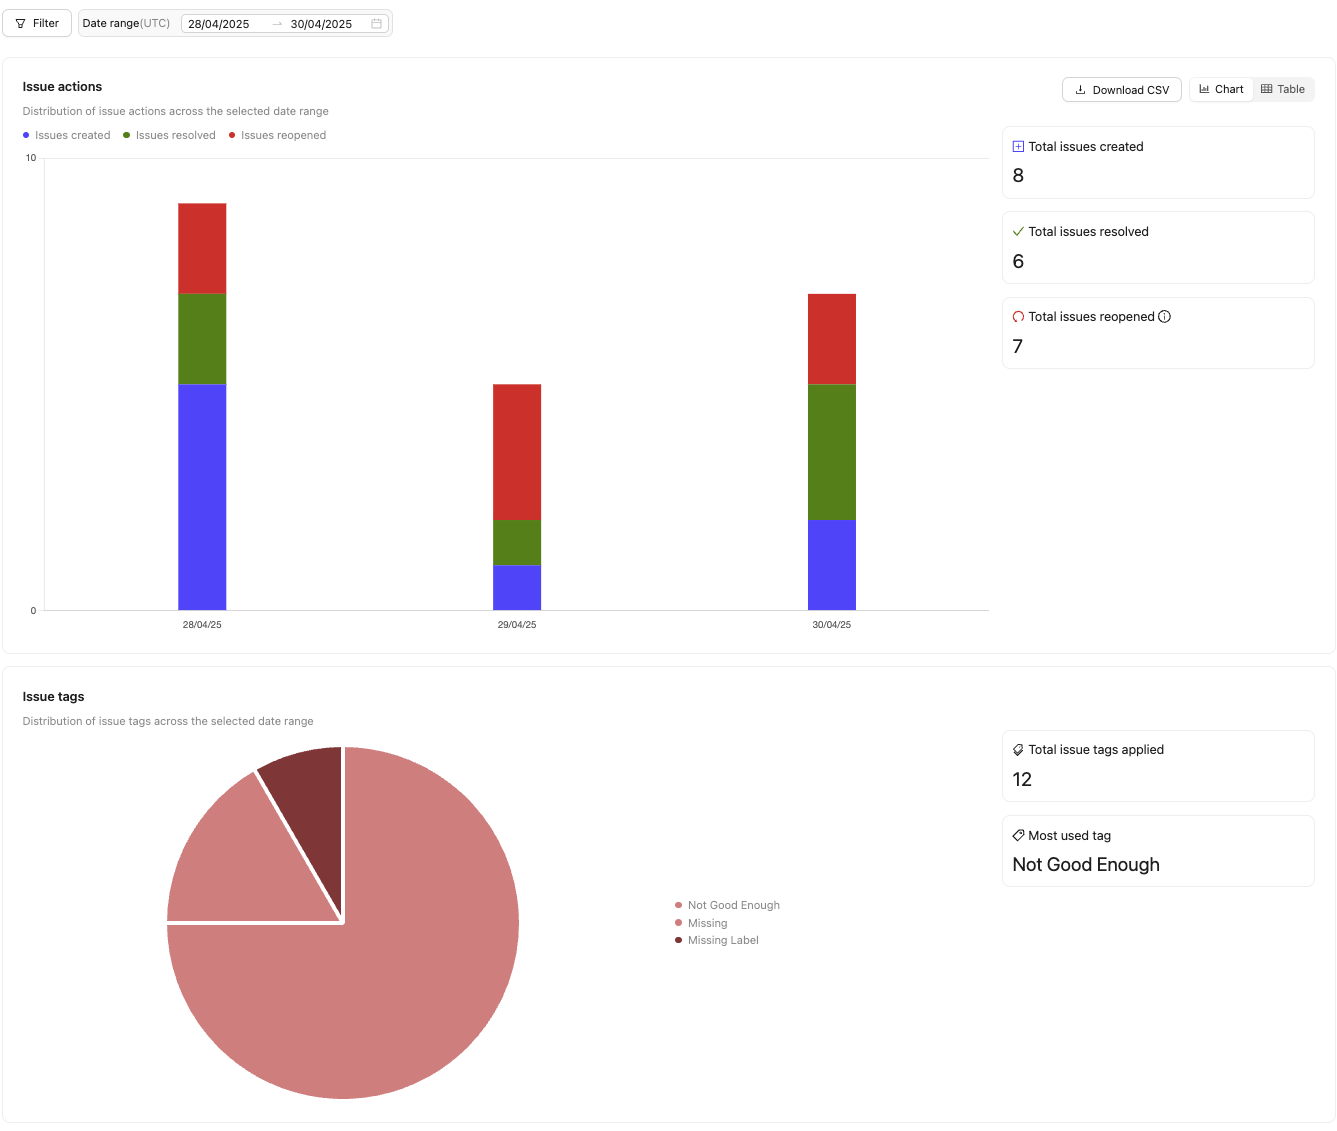
The Issue actions chart shows the following:
- Total issues created: The total number of issues created.
- Total issues resolved: The number of issues marked as resolved.
- Total issues reopened: The number of issues that were reopened.
- Total issues created = 19
- Total issues resolved = 20
- Total issues reopened = 2
- 19 issues were created.
- All 19 issues were resolved.
- 2 resolved issues were reopened. (This includes manually reopening an issue and re-rejections of labels)
- 1 of the reopened issues was resolved.
- There is one remaining open issue.
Agents
The Agents tab in the Analytics dashboard provides a detailed view of all Agents run in the Project.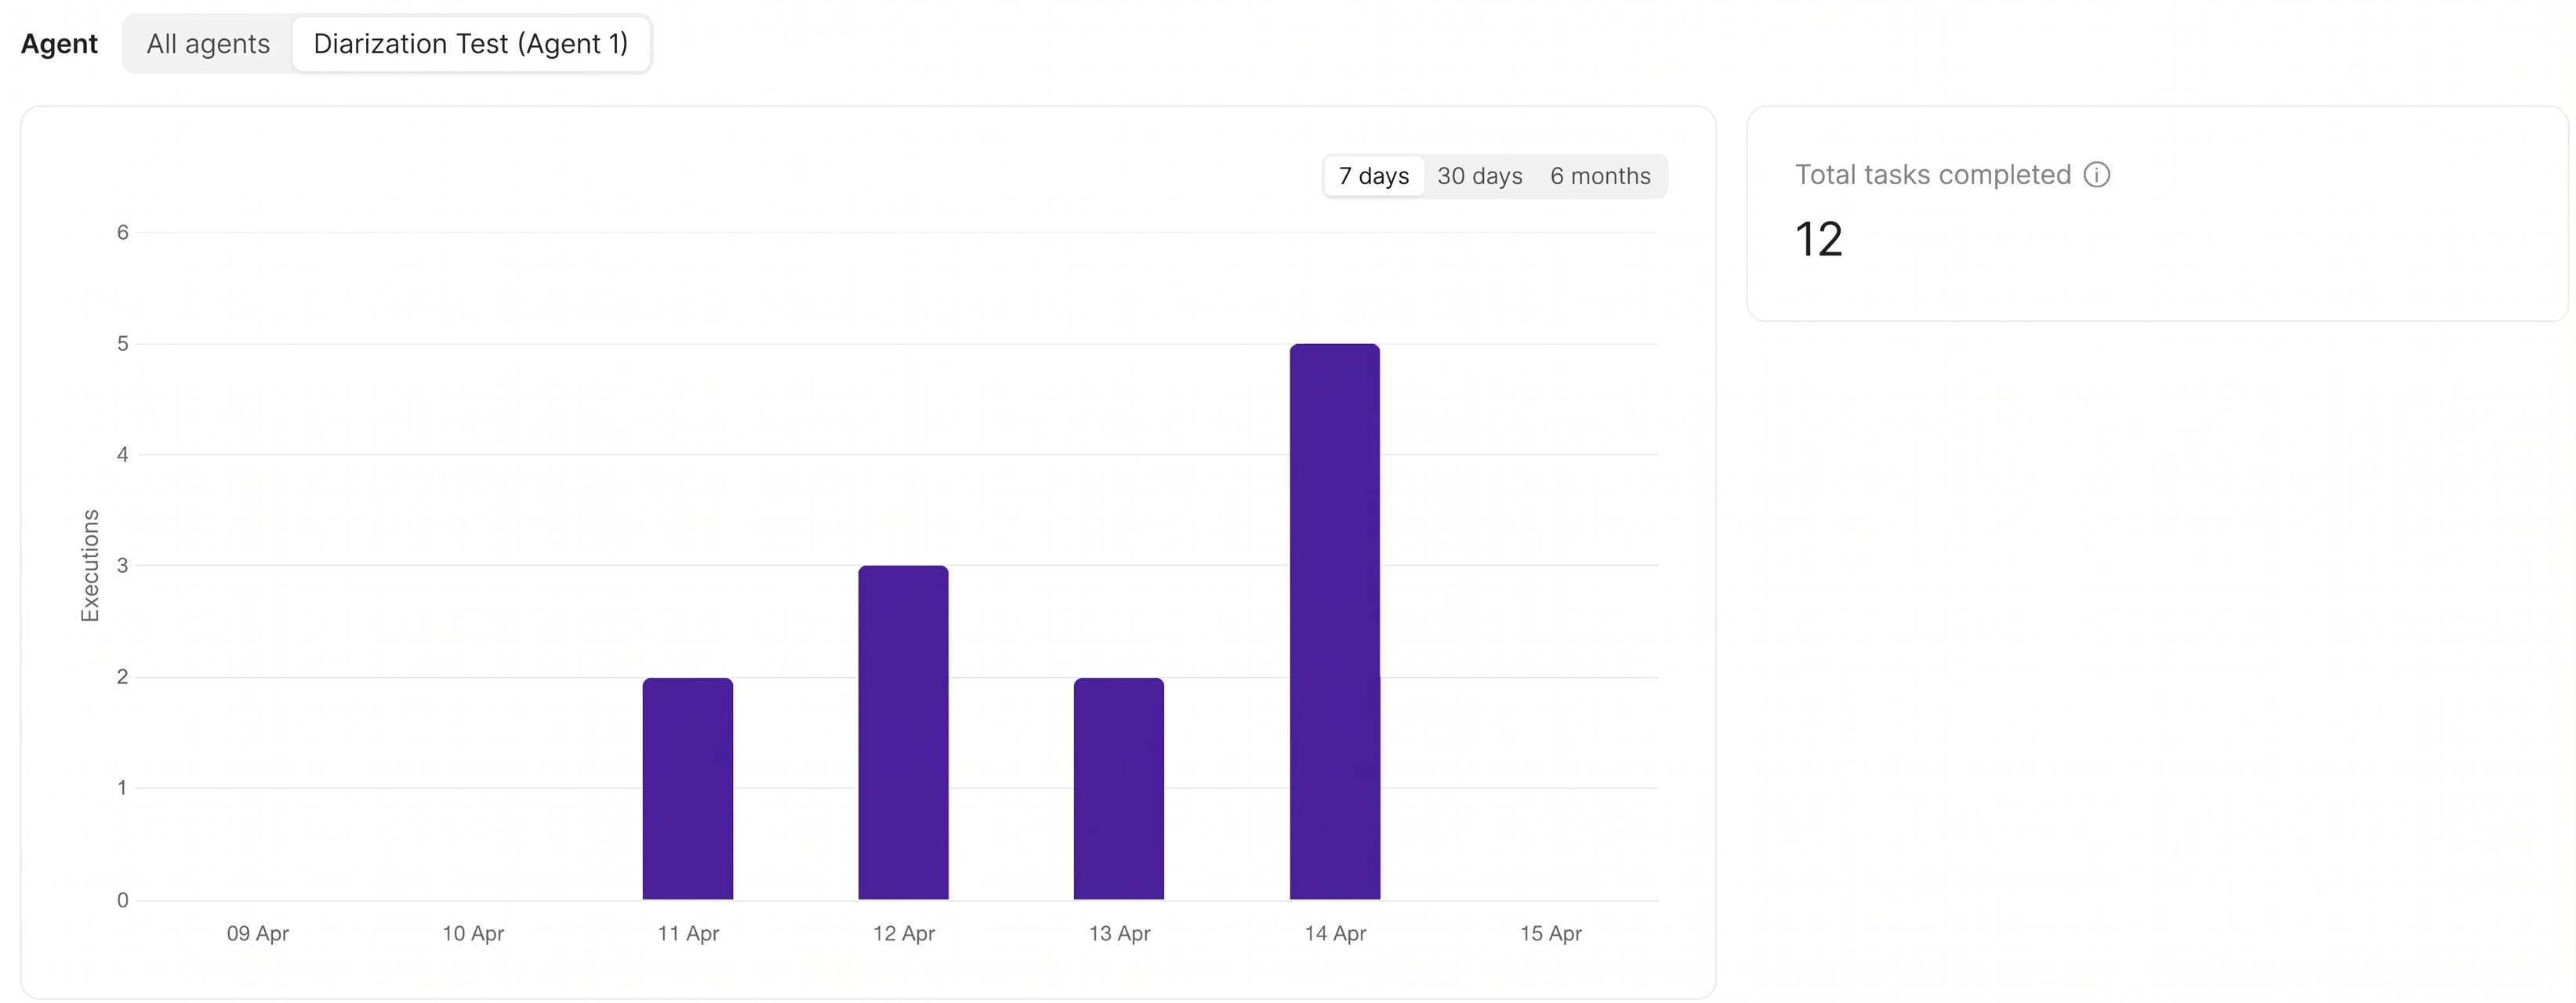
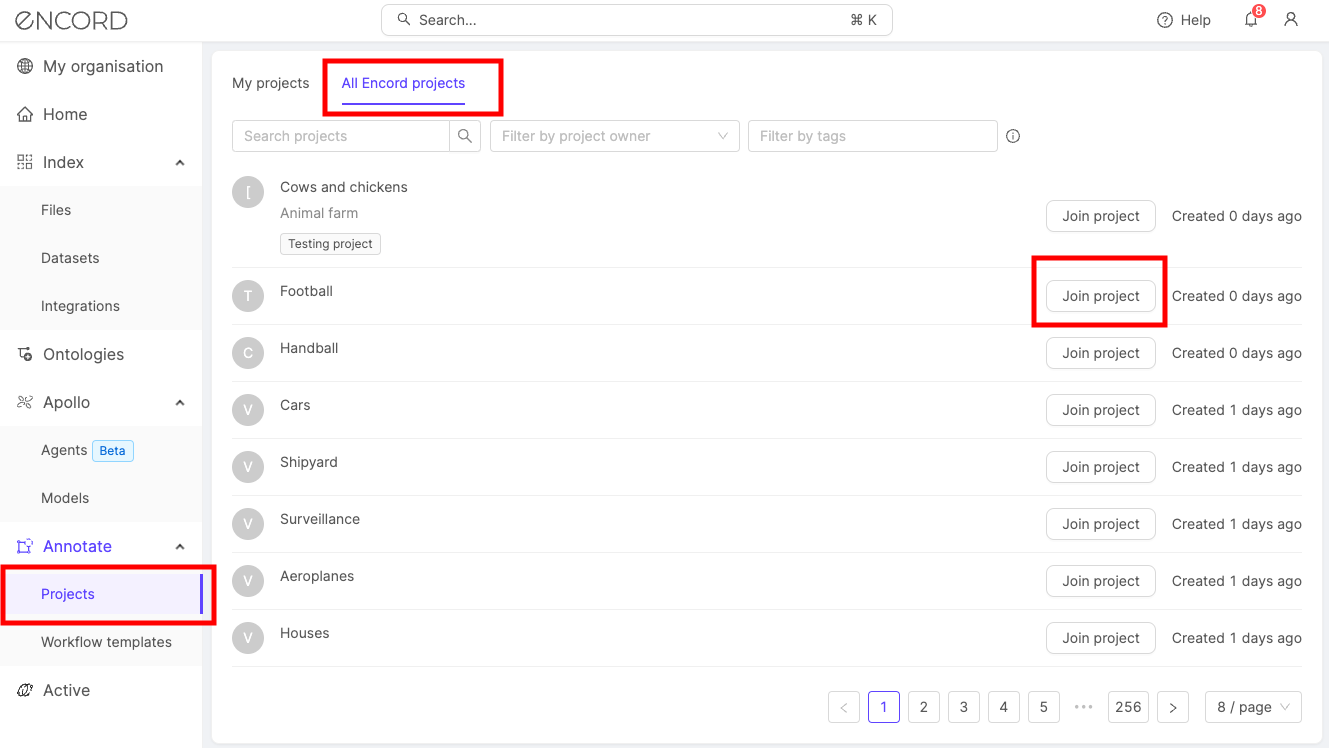
Join Projects in your Workspace
Workspace Admins can search for and join any Projects that exist within the Workspace. This includes Projects that contain no collaborators.- Navigate to Projects in the Encord platform.
- Select the All Encord projects tab.
- Find the Project you want to join.
- Click Join project to join the Project.